## Bar Chart: Model Performance on Programming Tasks
### Overview
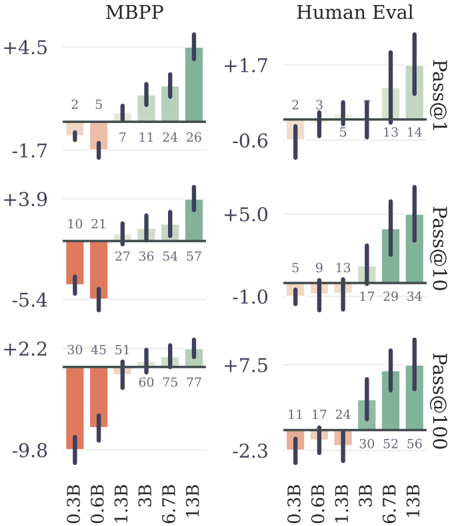
The image presents a comparative bar chart illustrating the performance of a model (MBPP) and human evaluation on programming tasks, across different model sizes (0.3B to 13B parameters). The performance is measured using three metrics: Pass@1, Pass@10, and Pass@100, representing the probability of generating a correct solution within the first, tenth, and hundredth attempt, respectively. The chart consists of six sub-charts arranged in a 2x3 grid.
### Components/Axes
* **X-axis:** Model Size (0.3B, 0.6B, 1.3B, 3B, 6.7B, 13B) - labeled in red.
* **Y-axis (MBPP columns):** Performance Score (ranging approximately from -10 to +5).
* **Y-axis (Human Eval columns):** Performance Score (ranging approximately from -3 to +8).
* **Color Coding:**
* Green: Represents positive performance gains.
* Red: Represents negative performance or loss.
* **Metrics:**
* Pass@1: Top row of charts.
* Pass@10: Middle row of charts.
* Pass@100: Bottom row of charts.
* **Titles:** "MBPP" (left column) and "Human Eval" (right column) are placed at the top of their respective columns.
* **Labels:** Numerical values are placed above each bar, indicating the specific performance score.
### Detailed Analysis or Content Details
**MBPP (Left Column)**
* **Pass@1 (Top Row):**
* 0.3B: Approximately -1.7, labeled "2".
* 0.6B: Approximately -1.7, labeled "5".
* 1.3B: Approximately 0.0, labeled "7".
* 3B: Approximately +1.5, labeled "11".
* 6.7B: Approximately +3.0, labeled "26".
* 13B: Approximately +4.5, labeled "26".
* Trend: The performance increases steadily from 0.3B to 13B.
* **Pass@10 (Middle Row):**
* 0.3B: Approximately -5.4, labeled "10".
* 0.6B: Approximately -5.4, labeled "21".
* 1.3B: Approximately -1.5, labeled "27".
* 3B: Approximately +1.5, labeled "36".
* 6.7B: Approximately +3.5, labeled "54".
* 13B: Approximately +3.9, labeled "57".
* Trend: Performance increases with model size, with a more pronounced increase from 1.3B to 3B.
* **Pass@100 (Bottom Row):**
* 0.3B: Approximately -9.8, labeled "30".
* 0.6B: Approximately -9.8, labeled "45".
* 1.3B: Approximately -2.0, labeled "51".
* 3B: Approximately +0.5, labeled "60".
* 6.7B: Approximately +2.0, labeled "75".
* 13B: Approximately +2.2, labeled "77".
* Trend: Similar to Pass@10, performance improves with model size.
**Human Eval (Right Column)**
* **Pass@1 (Top Row):**
* 0.3B: Approximately -0.6, labeled "2".
* 0.6B: Approximately -0.6, labeled "3".
* 1.3B: Approximately 0.0, labeled "5".
* 3B: Approximately +1.0, labeled "13".
* 6.7B: Approximately +1.7, labeled "14".
* 13B: Approximately +1.7, labeled "14".
* Trend: Performance increases with model size, plateauing at 6.7B and 13B.
* **Pass@10 (Middle Row):**
* 0.3B: Approximately -1.0, labeled "5".
* 0.6B: Approximately -1.0, labeled "9".
* 1.3B: Approximately +0.5, labeled "13".
* 3B: Approximately +2.0, labeled "17".
* 6.7B: Approximately +4.0, labeled "34".
* 13B: Approximately +5.0, labeled "34".
* Trend: Performance increases with model size, with a significant jump between 3B and 6.7B.
* **Pass@100 (Bottom Row):**
* 0.3B: Approximately -2.3, labeled "11".
* 0.6B: Approximately -2.3, labeled "17".
* 1.3B: Approximately +0.5, labeled "24".
* 3B: Approximately +3.0, labeled "30".
* 6.7B: Approximately +5.5, labeled "52".
* 13B: Approximately +7.5, labeled "56".
* Trend: Performance increases with model size, with a substantial increase from 3B to 6.7B.
### Key Observations
* The model performance (MBPP) consistently improves with increasing model size across all three metrics (Pass@1, Pass@10, Pass@100).
* Human evaluation also shows a similar trend of improvement with model size, but the gains appear to plateau at larger model sizes (6.7B and 13B).
* The performance gap between the model and human evaluation widens as the model size increases, particularly for Pass@10 and Pass@100.
* The red bars indicate that smaller models (0.3B and 0.6B) perform poorly on all metrics, exhibiting negative performance scores.
### Interpretation
The data suggests that increasing model size significantly improves performance on programming tasks, as measured by the Pass@k metrics. This is evident in both the MBPP and Human Eval columns. However, the rate of improvement appears to diminish for human evaluation at larger model sizes, indicating a potential limit to the benefits of simply scaling up the model. The widening gap between model and human performance suggests that while the model is becoming more proficient at generating correct solutions, it may still lack the nuanced understanding and problem-solving abilities of a human programmer. The negative performance scores for smaller models highlight the importance of model size for achieving reasonable performance on these tasks. The consistent trend across all metrics reinforces the conclusion that model size is a crucial factor in determining the effectiveness of these models for code generation. The use of different Pass@k metrics allows for a nuanced understanding of the model's ability to generate correct solutions with varying levels of attempts.