## Line Chart: Similarity vs. Reasoning Step
### Overview
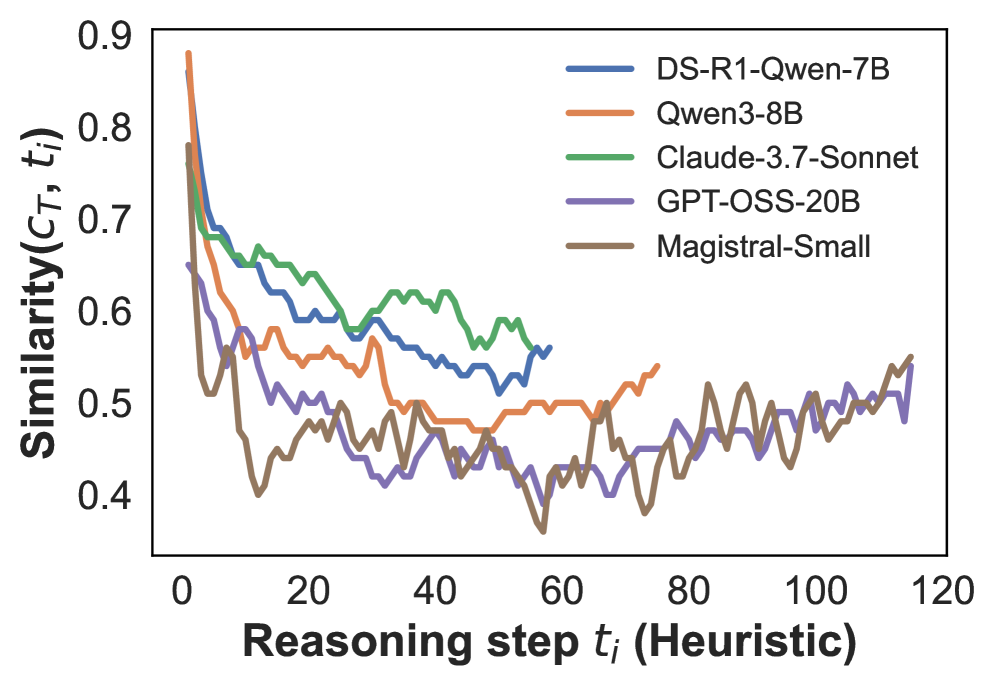
The image is a line chart comparing the similarity scores of five different language models (DS-R1-Qwen-7B, Qwen3-8B, Claude-3.7-Sonnet, GPT-OSS-20B, and Magistral-Small) across a range of reasoning steps. The x-axis represents the reasoning step (Heuristic), and the y-axis represents the similarity score.
### Components/Axes
* **X-axis:** Reasoning step *t<sub>i</sub>* (Heuristic). Scale ranges from 0 to 120, with tick marks at intervals of 20.
* **Y-axis:** Similarity(*C<sub>T</sub>*, *t<sub>i</sub>*). Scale ranges from 0.4 to 0.9, with tick marks at intervals of 0.1.
* **Legend:** Located at the top-right of the chart, identifying each line by model name:
* Blue: DS-R1-Qwen-7B
* Orange: Qwen3-8B
* Green: Claude-3.7-Sonnet
* Purple: GPT-OSS-20B
* Brown: Magistral-Small
### Detailed Analysis
* **DS-R1-Qwen-7B (Blue):** Starts at approximately 0.75 at step 0, decreases to around 0.55 by step 20, fluctuates between 0.5 and 0.6 until step 60, and then remains relatively stable around 0.55.
* **Qwen3-8B (Orange):** Starts at approximately 0.88 at step 0, decreases sharply to around 0.5 at step 20, fluctuates around 0.5 until step 80, and then shows a slight upward trend to approximately 0.55 by step 120.
* **Claude-3.7-Sonnet (Green):** Starts at approximately 0.7 at step 0, decreases to around 0.6 at step 10, then fluctuates between 0.6 and 0.65 until step 60, and then remains relatively stable around 0.6.
* **GPT-OSS-20B (Purple):** Starts at approximately 0.65 at step 0, decreases to around 0.45 by step 20, fluctuates between 0.4 and 0.5 until step 120.
* **Magistral-Small (Brown):** Starts at approximately 0.68 at step 0, decreases to around 0.45 by step 10, fluctuates between 0.4 and 0.55 until step 120.
### Key Observations
* All models show a decrease in similarity score in the initial reasoning steps.
* Claude-3.7-Sonnet consistently maintains the highest similarity score after the initial drop.
* GPT-OSS-20B and Magistral-Small have the lowest and most fluctuating similarity scores.
* Qwen3-8B shows a slight upward trend towards the end of the reasoning steps.
### Interpretation
The chart illustrates how the similarity of the language models' reasoning changes as the number of reasoning steps increases. The initial drop in similarity suggests that the models' reasoning becomes less consistent or accurate in the early stages. Claude-3.7-Sonnet appears to be the most stable and consistent model in terms of similarity, while GPT-OSS-20B and Magistral-Small show more variability. The slight upward trend of Qwen3-8B towards the end might indicate some improvement in reasoning consistency with more steps. The data suggests that different language models have varying levels of stability and consistency in their reasoning processes.