## Bar Chart: Performance Comparison
### Overview
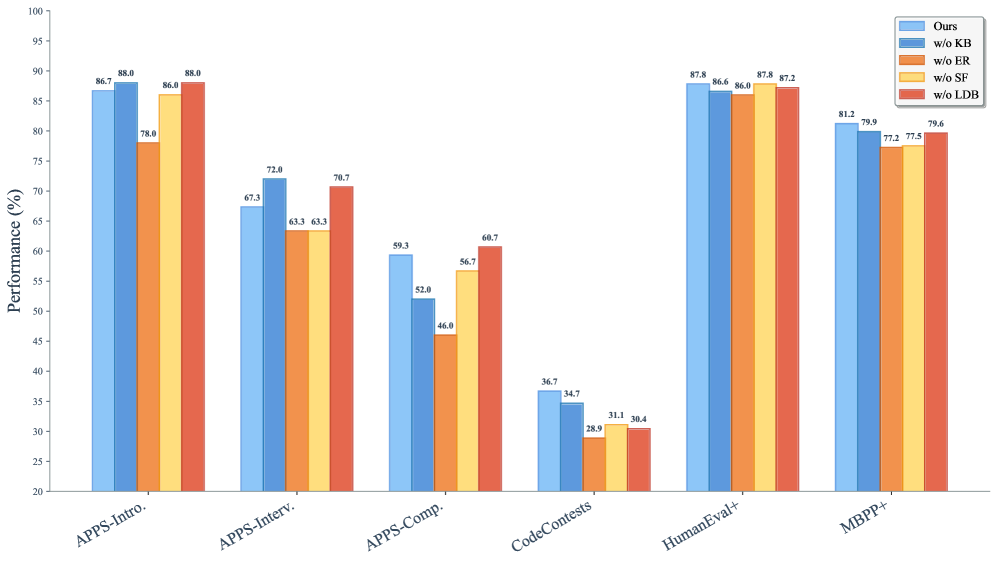
The image is a bar chart comparing the performance of a model ("Ours") against four variants where specific components (KB, ER, SF, LDB) have been removed. The chart displays performance percentages across five different tasks: APPS-Intro, APPS-Interv, APPS-Comp, CodeContests, HumanEval+, and MBPP+.
### Components/Axes
* **Y-axis:** "Performance (%)", ranging from 20% to 100% in increments of 5%.
* **X-axis:** Categorical axis representing the different tasks: APPS-Intro, APPS-Interv, APPS-Comp, CodeContests, HumanEval+, and MBPP+.
* **Legend:** Located at the top-right of the chart.
* Blue: "Ours"
* Darker Blue: "w/o KB"
* Orange: "w/o ER"
* Yellow: "w/o SF"
* Red: "w/o LDB"
### Detailed Analysis
Here's a breakdown of the performance for each task and model variant:
* **APPS-Intro:**
* Ours (Blue): 86.7%
* w/o KB (Darker Blue): 88.0%
* w/o ER (Orange): 78.0%
* w/o SF (Yellow): 86.0%
* w/o LDB (Red): 88.0%
* **APPS-Interv:**
* Ours (Blue): 67.3%
* w/o KB (Darker Blue): 72.0%
* w/o ER (Orange): 63.3%
* w/o SF (Yellow): 63.3%
* w/o LDB (Red): 70.7%
* **APPS-Comp:**
* Ours (Blue): 59.3%
* w/o KB (Darker Blue): 52.0%
* w/o ER (Orange): 46.0%
* w/o SF (Yellow): 56.7%
* w/o LDB (Red): 60.7%
* **CodeContests:**
* Ours (Blue): 36.7%
* w/o KB (Darker Blue): 34.7%
* w/o ER (Orange): 28.9%
* w/o SF (Yellow): 31.1%
* w/o LDB (Red): 30.4%
* **HumanEval+:**
* Ours (Blue): 87.8%
* w/o KB (Darker Blue): 86.6%
* w/o ER (Orange): 86.0%
* w/o SF (Yellow): 87.8%
* w/o LDB (Red): 87.2%
* **MBPP+:**
* Ours (Blue): 81.2%
* w/o KB (Darker Blue): 79.9%
* w/o ER (Orange): 77.2%
* w/o SF (Yellow): 77.5%
* w/o LDB (Red): 79.6%
### Key Observations
* The "Ours" model generally performs competitively across all tasks.
* Removing KB ("w/o KB") sometimes improves performance (APPS-Intro), but can also decrease it (APPS-Comp).
* Removing ER ("w/o ER") consistently results in lower performance compared to "Ours".
* Removing SF ("w/o SF") results in performance close to "Ours".
* Removing LDB ("w/o LDB") results in performance close to "Ours".
* The performance varies significantly across different tasks, with CodeContests showing the lowest scores.
### Interpretation
The chart indicates the relative importance of the different components (KB, ER, SF, LDB) for the model's performance on various programming tasks. Removing ER consistently hurts performance, suggesting it is a crucial component. Removing KB has a mixed impact, indicating it might be more specialized for certain tasks. SF and LDB appear to have less impact on overall performance. The wide range of performance across tasks highlights the model's varying effectiveness depending on the specific challenge. The "Ours" model serves as a benchmark, and the other bars show the impact of ablating different components.