## Bar Charts: MUSE vs. Dreamer-v3 Performance
### Overview
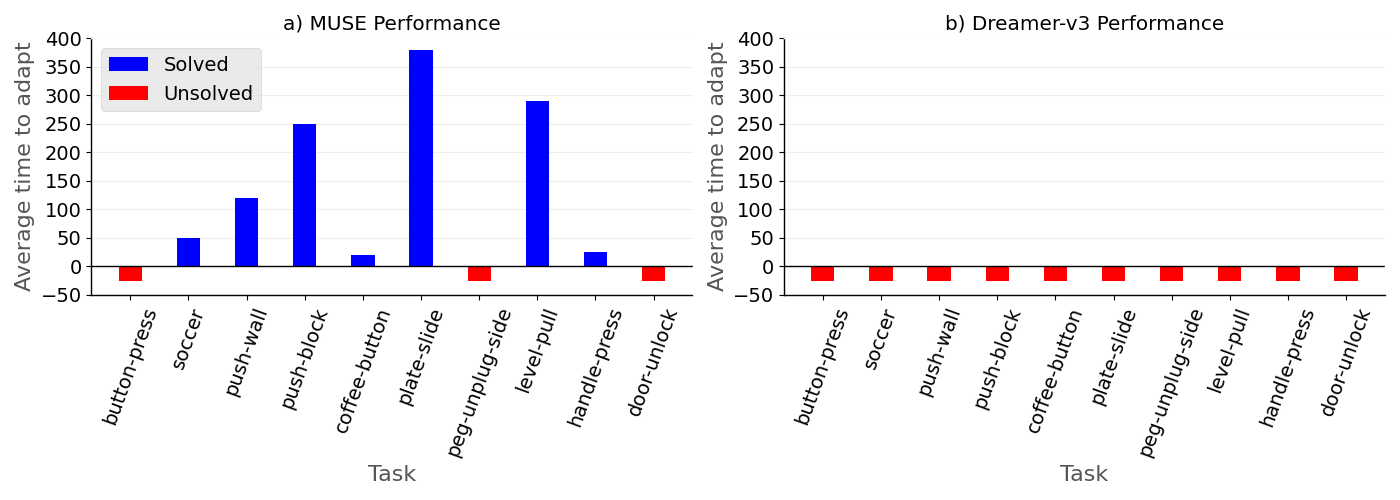
The image contains two bar charts comparing the performance of two systems, MUSE and Dreamer-v3, on a set of tasks. The charts display the average time to adapt for each task, with blue bars indicating tasks that were solved and red bars indicating tasks that were not solved.
### Components/Axes
**Chart a) MUSE Performance:**
* **Title:** a) MUSE Performance
* **Y-axis:** Average time to adapt
* Scale: 0 to 400, with increments of 50.
* **X-axis:** Task
* Categories: button-press, soccer, push-wall, push-block, coffee-button, plate-slide, peg-unplug-side, level-pull, handle-press, door-unlock
* **Legend:** Located in the top-left corner.
* Blue: Solved
* Red: Unsolved
**Chart b) Dreamer-v3 Performance:**
* **Title:** b) Dreamer-v3 Performance
* **Y-axis:** Average time to adapt
* Scale: 0 to 400, with increments of 50.
* **X-axis:** Task
* Categories: button-press, soccer, push-wall, push-block, coffee-button, plate-slide, peg-unplug-side, level-pull, handle-press, door-unlock
* **Legend:** (Implicitly the same as MUSE, as no legend is present)
* Blue: Solved
* Red: Unsolved
### Detailed Analysis
**Chart a) MUSE Performance:**
* **button-press:** Unsolved (Red bar) at approximately -25.
* **soccer:** Solved (Blue bar) at approximately 50.
* **push-wall:** Solved (Blue bar) at approximately 125.
* **push-block:** Solved (Blue bar) at approximately 250.
* **coffee-button:** Solved (Blue bar) at approximately 25.
* **plate-slide:** Solved (Blue bar) at approximately 380.
* **peg-unplug-side:** Unsolved (Red bar) at approximately -25.
* **level-pull:** Solved (Blue bar) at approximately 290.
* **handle-press:** Solved (Blue bar) at approximately 25.
* **door-unlock:** Unsolved (Red bar) at approximately -25.
**Chart b) Dreamer-v3 Performance:**
* **button-press:** Unsolved (Red bar) at approximately -25.
* **soccer:** Unsolved (Red bar) at approximately -25.
* **push-wall:** Unsolved (Red bar) at approximately -25.
* **push-block:** Unsolved (Red bar) at approximately -25.
* **coffee-button:** Unsolved (Red bar) at approximately -25.
* **plate-slide:** Unsolved (Red bar) at approximately -25.
* **peg-unplug-side:** Unsolved (Red bar) at approximately -25.
* **level-pull:** Unsolved (Red bar) at approximately -25.
* **handle-press:** Unsolved (Red bar) at approximately -25.
* **door-unlock:** Unsolved (Red bar) at approximately -25.
### Key Observations
* MUSE solves most tasks, with 'plate-slide' requiring the highest average time to adapt.
* Dreamer-v3 fails to solve any of the tasks, with all tasks showing a negative average time to adapt (represented by red bars at approximately -25).
### Interpretation
The data suggests that MUSE significantly outperforms Dreamer-v3 on the given set of tasks. MUSE is able to solve most of the tasks, while Dreamer-v3 fails to solve any of them. The negative average time to adapt for Dreamer-v3 across all tasks is unusual and may indicate a specific issue with the system's adaptation process or how the metric is being calculated. The 'plate-slide' task appears to be the most challenging for MUSE, requiring a substantially longer adaptation time compared to other solved tasks.