\n
## Diagram: Shape Arrangement Visualization
### Overview
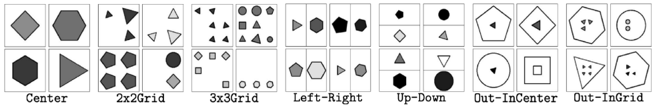
The image presents a visual arrangement of geometric shapes within a grid-like structure. It appears to be a demonstration of different shape placements and patterns, labeled with descriptive names. The arrangement is organized into two rows, each containing seven distinct configurations.
### Components/Axes
The diagram consists of the following labeled configurations, positioned horizontally across two rows:
* **Center:** A hexagon and a diamond.
* **2x2Grid:** Four triangles (two dark, two light) arranged in a 2x2 grid.
* **3x3Grid:** Nine circles (some dark, some light) arranged in a 3x3 grid.
* **Left-Right:** Two hexagons (one dark, one light) and two circles (one dark, one light) arranged horizontally.
* **Up-Down:** A dark circle, a triangle, and a dark circle arranged vertically.
* **Out-InCenter:** A pentagon and a square, with a dark circle in the center.
* **Out-InGrid:** A triangle and a hexagon, with three dark circles arranged in a grid.
The shapes used are: hexagons, diamonds, triangles, circles, squares, and pentagons. The shapes are filled with either a dark or light gray color.
### Detailed Analysis / Content Details
Each configuration displays a unique arrangement of shapes and colors.
* **Center:** Contains one dark hexagon and one light diamond.
* **2x2Grid:** Contains two dark triangles and two light triangles.
* **3x3Grid:** Contains five light circles and four dark circles.
* **Left-Right:** Contains one dark hexagon, one light hexagon, one dark circle, and one light circle.
* **Up-Down:** Contains one dark circle, one light triangle, and one dark circle.
* **Out-InCenter:** Contains one light pentagon, one light square, and one dark circle.
* **Out-InGrid:** Contains one light triangle, one light hexagon, and three dark circles.
### Key Observations
The diagram focuses on the spatial relationships between shapes and the use of color to differentiate them. The configurations vary in complexity, from simple arrangements of two shapes to more intricate grids. The labels suggest an exploration of how shapes can be organized within different spatial constraints.
### Interpretation
This diagram likely serves as a visual aid for understanding concepts related to spatial arrangement, pattern recognition, or visual design. It could be used to illustrate principles of composition, balance, or hierarchy in visual communication. The use of both dark and light shapes may represent different levels of emphasis or importance. The labels ("Center", "Grid", "Left-Right", etc.) indicate the organizing principle behind each arrangement. The diagram doesn't present numerical data or trends, but rather a qualitative exploration of visual possibilities. It is a demonstration of visual elements and their arrangement, rather than a representation of data.