\n
## Bar Charts: SHD Test Accuracy vs. Sparsity Regularization Constant
### Overview
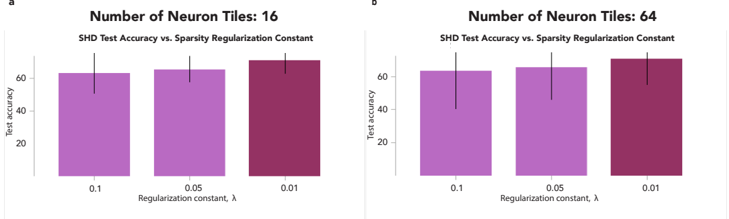
The image presents two bar charts, labeled 'a' and 'b', comparing SHD (Structural Hamming Distance) Test Accuracy against the Sparsity Regularization Constant (λ) for different numbers of neuron tiles. Chart 'a' shows results for 16 neuron tiles, while chart 'b' shows results for 64 neuron tiles. Each chart displays three bars representing different regularization constants: 0.1, 0.05, and 0.01. Error bars are present on top of each bar, indicating the variability in the test accuracy.
### Components/Axes
* **X-axis:** "Regularization constant, λ" with markers at 0.1, 0.05, and 0.01.
* **Y-axis:** "Test accuracy" with a scale ranging from 20 to 70, incrementing by 10.
* **Titles:**
* Chart a: "Number of Neuron Tiles: 16" and "SHD Test Accuracy vs. Sparsity Regularization Constant"
* Chart b: "Number of Neuron Tiles: 64" and "SHD Test Accuracy vs. Sparsity Regularization Constant"
* **Bars:** Represent test accuracy for each regularization constant.
* **Error Bars:** Indicate the standard deviation or confidence interval of the test accuracy.
### Detailed Analysis or Content Details
**Chart a (16 Neuron Tiles):**
* **λ = 0.1:** The bar is approximately at a height of 64. The error bar extends from approximately 60 to 68.
* **λ = 0.05:** The bar is approximately at a height of 63. The error bar extends from approximately 59 to 67.
* **λ = 0.01:** The bar is approximately at a height of 66. The error bar extends from approximately 62 to 70.
**Chart b (64 Neuron Tiles):**
* **λ = 0.1:** The bar is approximately at a height of 61. The error bar extends from approximately 57 to 65.
* **λ = 0.05:** The bar is approximately at a height of 60. The error bar extends from approximately 56 to 64.
* **λ = 0.01:** The bar is approximately at a height of 65. The error bar extends from approximately 61 to 69.
In both charts, the bars are colored in shades of purple, with the bar corresponding to λ = 0.01 being the darkest shade.
### Key Observations
* In both charts, the test accuracy generally increases as the regularization constant (λ) increases from 0.1 to 0.01.
* The error bars suggest that the variability in test accuracy is similar across different regularization constants for both 16 and 64 neuron tiles.
* The difference in test accuracy between the different regularization constants is relatively small, especially for 16 neuron tiles.
* The test accuracy is slightly higher for 64 neuron tiles compared to 16 neuron tiles, particularly at λ = 0.01.
### Interpretation
The data suggests that increasing the sparsity regularization constant (λ) generally leads to a slight improvement in SHD test accuracy. This indicates that introducing more sparsity in the model can be beneficial for performance. The relatively small differences in test accuracy between the different regularization constants suggest that the model is not highly sensitive to the choice of λ within the tested range.
The slightly higher test accuracy observed for 64 neuron tiles compared to 16 neuron tiles suggests that increasing the number of neuron tiles can also improve performance, potentially by allowing the model to learn more complex representations. However, the improvement is not substantial, and the optimal number of neuron tiles may depend on other factors, such as the size and complexity of the dataset.
The error bars indicate that the results are subject to some variability, and further experiments with larger sample sizes may be needed to confirm these findings. The charts demonstrate a trade-off between model complexity (number of neuron tiles) and regularization strength (λ), and the optimal balance between these two factors may depend on the specific application and dataset.