## Scatter Plot: Accuracy vs. Time-to-Answer
### Overview
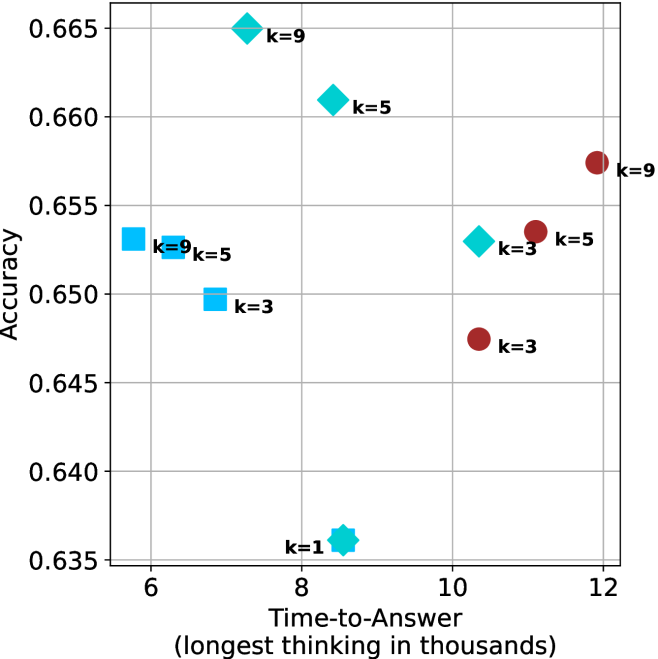
This image is a scatter plot visualizing the relationship between "Accuracy" (y-axis) and "Time-to-Answer" (x-axis). The plot displays data points categorized by shape and color, with specific "k" values (likely representing a parameter such as k-nearest neighbors, chain-of-thought steps, or similar inference parameters) labeled next to each point.
### Components/Axes
* **Y-Axis (Accuracy):** Ranges from 0.635 to 0.665, with grid lines at 0.005 intervals.
* **X-Axis (Time-to-Answer):** Labeled "Time-to-Answer (longest thinking in thousands)". Ranges from 6 to 12, with grid lines at 1.0 intervals.
* **Data Series:**
* **Light Blue (Cyan) Points:** Includes Squares, Diamonds, and a Star shape.
* **Dark Red (Maroon) Points:** Includes Circles.
* **Labels:** Each data point (or cluster) is annotated with a "k=" value, indicating the parameter setting for that specific data point.
### Detailed Analysis
The following data points are extracted based on their approximate coordinates (x, y) and associated labels.
| Shape | Color | Approx. X (Time) | Approx. Y (Accuracy) | Label |
| :--- | :--- | :--- | :--- | :--- |
| Diamond | Light Blue | 7.2 | 0.665 | k=9 |
| Diamond | Light Blue | 8.5 | 0.661 | k=5 |
| Star | Light Blue | 8.5 | 0.636 | k=1 |
| Square | Light Blue | 6.5 | 0.653 | k=9 |
| Square | Light Blue | 6.0 | 0.653 | Unlabeled |
| Square | Light Blue | 7.0 | 0.650 | k=3 |
| Diamond | Light Blue | 10.3 | 0.653 | k=3 |
| Circle | Dark Red | 10.3 | 0.648 | k=3 |
| Circle | Dark Red | 11.2 | 0.654 | k=5 |
| Circle | Dark Red | 11.9 | 0.658 | k=9 |
### Key Observations
* **Clustering:** The data is split into two distinct groups based on "Time-to-Answer":
* **Low-Time Group (6.0–8.5):** Primarily Light Blue shapes (Squares, Diamonds, Star). This group shows higher variance in accuracy, ranging from the lowest point (k=1 at 0.636) to the highest point (k=9 at 0.665).
* **High-Time Group (10.3–11.9):** Primarily Dark Red circles, with one Light Blue diamond outlier.
* **Trend in Dark Red Group:** There is a clear positive correlation between the "k" value and accuracy within the Dark Red circle group. As "k" increases from 3 to 5 to 9, the accuracy increases (0.648 -> 0.654 -> 0.658) and the time-to-answer increases.
* **Outliers:** The Light Blue Star (k=1) at (8.5, 0.636) is the significant outlier, representing the lowest accuracy on the entire chart.
### Interpretation
The data suggests a trade-off between computational time and model accuracy, likely comparing two different inference methods or model architectures.
1. **Method Efficiency:** The Light Blue group (Squares/Diamonds) achieves high accuracy (up to 0.665) at significantly lower time costs (around 7-8k) compared to the Dark Red group. However, this method is sensitive to the "k" parameter, as evidenced by the sharp drop in accuracy for the k=1 star.
2. **Parameter Scaling:** The Dark Red group demonstrates a predictable, linear-like scaling behavior: increasing the "k" parameter consistently improves accuracy but incurs a linear penalty in "Time-to-Answer."
3. **Strategic Choice:** If the goal is maximum accuracy, the Light Blue Diamond (k=9) at ~7.2k time is the optimal choice, as it outperforms the highest Dark Red point (k=9 at ~11.9k) while requiring significantly less time. The Dark Red method appears to be less efficient in this specific accuracy range.