## Line Chart: COLLIE Model Scores
### Overview
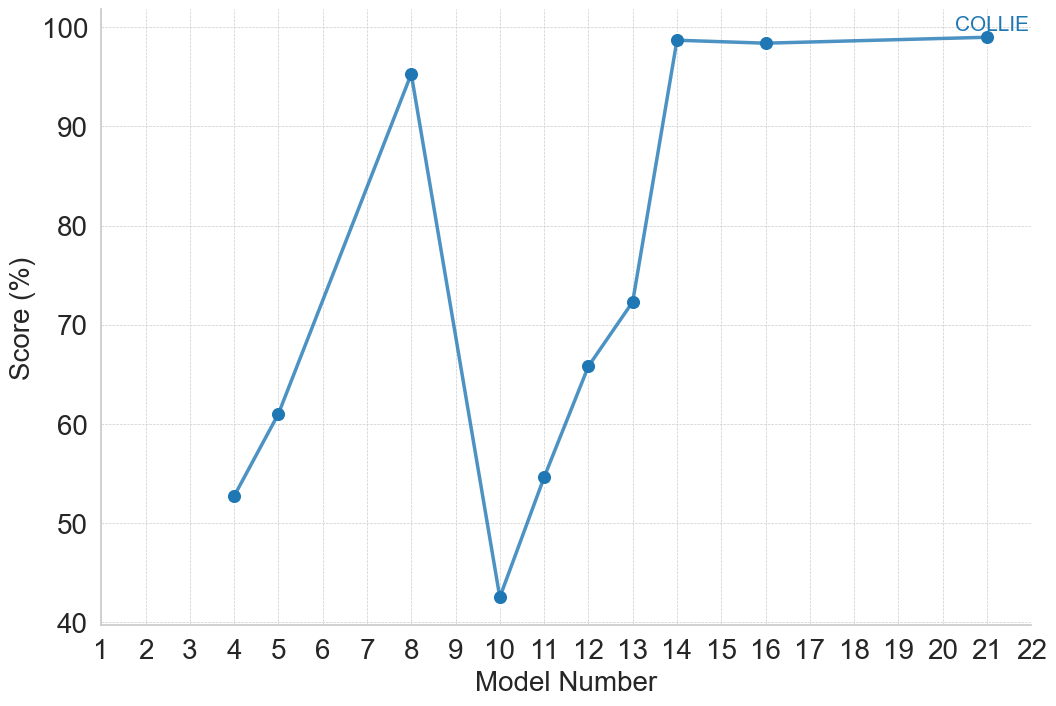
The image displays a line chart plotting the performance scores (in percentage) of a series of models identified by sequential numbers. The chart shows significant volatility in scores across the early model numbers, followed by a sharp recovery and a plateau at a very high score for the later models.
### Components/Axes
* **Chart Type:** Line chart with data points marked by circular markers.
* **Title/Series Label:** "COLLIE" is displayed in the top-right corner of the chart area, associated with the blue data line.
* **X-Axis:**
* **Label:** "Model Number"
* **Scale:** Linear scale from 1 to 22.
* **Markers:** Major tick marks and labels are present for every integer from 1 to 22.
* **Y-Axis:**
* **Label:** "Score (%)"
* **Scale:** Linear scale from 40 to 100.
* **Markers:** Major tick marks and labels are present at intervals of 10 (40, 50, 60, 70, 80, 90, 100).
* **Legend:** A single entry, "COLLIE", is positioned in the top-right quadrant of the chart, near the final data points. It corresponds to the blue line and markers.
* **Grid:** A light gray grid is present, with horizontal lines at each major y-axis tick and vertical lines at each major x-axis tick.
### Detailed Analysis
**Data Series (COLLIE):**
The blue line connects data points for specific model numbers. The trend is non-monotonic, with a major dip.
* **Trend Verification:** The line starts at a moderate score, rises to a peak, plummets to a low point, then climbs steeply before leveling off at a near-maximum score.
* **Data Points (Approximate Values):**
* Model 4: ~53%
* Model 5: ~61%
* Model 8: ~95% (First Peak)
* Model 10: ~43% (Global Minimum)
* Model 11: ~55%
* Model 12: ~66%
* Model 13: ~72%
* Model 14: ~98% (Start of Plateau)
* Model 16: ~98%
* Model 21: ~99% (Final Point)
**Spatial Grounding:** The legend "COLLIE" is placed in the top-right, directly above the plateau region of the line it describes. All data points are connected by the same blue line, confirming they belong to the same series.
### Key Observations
1. **High Volatility:** Performance is highly variable between models 4 and 13, with swings of over 50 percentage points.
2. **Critical Drop:** Model 10 represents a severe performance degradation, scoring the lowest at ~43%.
3. **Strong Recovery:** Following the low at Model 10, there is a consistent and steep upward trend through Model 14.
4. **Performance Plateau:** From Model 14 onward (including Models 16 and 21), the score stabilizes at an excellent level between 98% and 99%, showing minimal variation.
5. **Missing Data:** No data points are plotted for Models 1-3, 6, 7, 9, 15, 17-20, or 22. The chart only shows performance for a subset of the model sequence.
### Interpretation
The chart suggests a development or tuning process for the "COLLIE" model series. The early models (4-13) appear to be in an experimental phase, where changes lead to unpredictable results, including a major failure at Model 10. This could indicate a problematic update, a change in training data, or an architectural flaw that was later corrected.
The sharp, consistent improvement from Model 10 to Model 14 implies a successful intervention or breakthrough. The subsequent plateau from Model 14 to Model 21 indicates that the model has reached a performance ceiling or a state of stability where further iterations yield only marginal gains. The high final scores (~99%) suggest the model is highly effective on the measured metric by the end of this sequence. The absence of data for many model numbers might mean only select versions were evaluated, or the chart highlights key milestones in the development timeline.