\n
## Violin Plot: Elementary Math Accuracy
### Overview
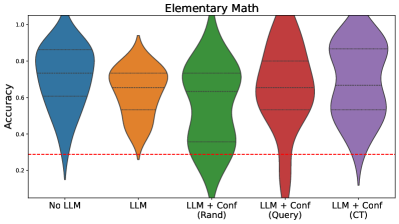
The image presents a violin plot comparing the accuracy of different approaches to solving elementary math problems. The x-axis represents the method used, and the y-axis represents the accuracy score. Five different methods are compared: "No LLM", "LLM", "LLM + Conf (Rand)", "LLM + Conf (Query)", and "LLM + Conf (CT)". A horizontal dashed red line is present at approximately 0.5 accuracy.
### Components/Axes
* **Title:** "Elementary Math" (centered at the top)
* **X-axis Label:** Method (categorical) with the following categories:
* "No LLM"
* "LLM"
* "LLM + Conf (Rand)"
* "LLM + Conf (Query)"
* "LLM + Conf (CT)"
* **Y-axis Label:** "Accuracy" (vertical, left side) with a scale ranging from approximately 0.2 to 1.0.
* **Horizontal Line:** A dashed red line at approximately y = 0.5.
### Detailed Analysis
The plot displays the distribution of accuracy scores for each method using violin plots.
* **No LLM (Blue):** The violin plot is centered around an accuracy of approximately 0.8, with a range from roughly 0.6 to 1.0. The distribution is relatively narrow, indicating consistent performance.
* **LLM (Orange):** The violin plot is centered around an accuracy of approximately 0.65, with a range from roughly 0.4 to 0.9. The distribution is wider than "No LLM", suggesting more variability.
* **LLM + Conf (Rand) (Green):** The violin plot is centered around an accuracy of approximately 0.75, with a range from roughly 0.5 to 0.95. The distribution is similar in width to "No LLM".
* **LLM + Conf (Query) (Red):** The violin plot is centered around an accuracy of approximately 0.7, with a range from roughly 0.45 to 0.95. The distribution is wider than "No LLM".
* **LLM + Conf (CT) (Purple):** The violin plot is centered around an accuracy of approximately 0.85, with a range from roughly 0.6 to 1.0. The distribution is similar in width to "No LLM".
### Key Observations
* The "No LLM" method has the highest median accuracy.
* The "LLM" method has the lowest median accuracy.
* Adding confidence information ("Conf") to the LLM improves accuracy compared to using the LLM alone, with "LLM + Conf (CT)" achieving the highest accuracy among the LLM-based methods.
* All methods generally achieve accuracy above the 0.5 threshold indicated by the red dashed line.
* The "LLM + Conf (Rand)" and "LLM + Conf (Query)" methods show a wider distribution of accuracy scores, indicating more variability in performance.
### Interpretation
The data suggests that while Large Language Models (LLMs) alone perform worse than a "No LLM" baseline on elementary math problems, incorporating confidence information can significantly improve their accuracy. The method of obtaining confidence information appears to matter, with "LLM + Conf (CT)" performing best. The violin plots reveal the spread of the data, showing that some methods are more consistent than others. The red dashed line at 0.5 likely represents a threshold for acceptable performance, and all methods exceed this threshold. The variability in the "LLM + Conf (Rand)" and "LLM + Conf (Query)" methods could indicate sensitivity to the specific problem instances or the randomness inherent in those confidence estimation techniques. The data implies that LLMs can be valuable tools for solving elementary math problems, but their effectiveness is highly dependent on how confidence information is integrated.