## Bar Chart: Goroutines vs. Execution Time
### Overview
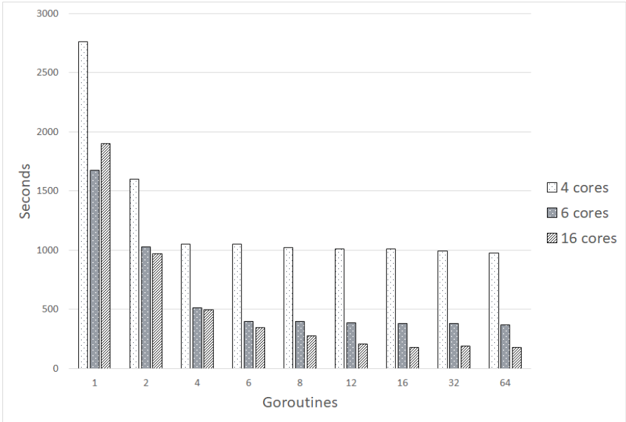
The image is a bar chart comparing the execution time (in seconds) of a program using different numbers of goroutines (1, 2, 4, 6, 8, 12, 16, 32, 64) on systems with 4, 6, and 16 cores. The chart shows how the execution time changes as the number of goroutines increases for each core configuration.
### Components/Axes
* **X-axis:** Goroutines (1, 2, 4, 6, 8, 12, 16, 32, 64)
* **Y-axis:** Seconds (0 to 3000, with increments of 500)
* **Legend (Top-Right):**
* White with dots: 4 cores
* Gray: 6 cores
* Dark Gray with dots: 16 cores
### Detailed Analysis
**4 Cores (White with dots):**
* Trend: Execution time decreases sharply from 1 to 2 goroutines, then decreases more gradually until 4 goroutines, and then remains relatively constant.
* 1 Goroutine: ~2750 seconds
* 2 Goroutines: ~1600 seconds
* 4 Goroutines: ~1050 seconds
* 6 Goroutines: ~1050 seconds
* 8 Goroutines: ~1050 seconds
* 12 Goroutines: ~1050 seconds
* 16 Goroutines: ~1050 seconds
* 32 Goroutines: ~1050 seconds
* 64 Goroutines: ~1000 seconds
**6 Cores (Gray):**
* Trend: Execution time decreases sharply from 1 to 2 goroutines, then decreases more gradually until 16 goroutines, and then remains relatively constant.
* 1 Goroutine: ~1700 seconds
* 2 Goroutines: ~1000 seconds
* 4 Goroutines: ~500 seconds
* 6 Goroutines: ~400 seconds
* 8 Goroutines: ~350 seconds
* 12 Goroutines: ~300 seconds
* 16 Goroutines: ~200 seconds
* 32 Goroutines: ~200 seconds
* 64 Goroutines: ~200 seconds
**16 Cores (Dark Gray with dots):**
* Trend: Execution time decreases sharply from 1 to 2 goroutines, then decreases more gradually until 16 goroutines, and then remains relatively constant.
* 1 Goroutine: ~1900 seconds
* 2 Goroutines: ~950 seconds
* 4 Goroutines: ~500 seconds
* 6 Goroutines: ~350 seconds
* 8 Goroutines: ~400 seconds
* 12 Goroutines: ~400 seconds
* 16 Goroutines: ~350 seconds
* 32 Goroutines: ~400 seconds
* 64 Goroutines: ~200 seconds
### Key Observations
* For all core configurations, increasing the number of goroutines initially results in a significant reduction in execution time.
* The execution time plateaus after a certain number of goroutines, suggesting diminishing returns.
* The 6-core configuration generally has the lowest execution time for higher numbers of goroutines.
* The 4-core configuration has the highest execution time across all numbers of goroutines.
### Interpretation
The data suggests that using goroutines can significantly improve the performance of a program, especially when the number of goroutines is optimized for the number of available cores. The initial decrease in execution time with increasing goroutines indicates that the program can effectively utilize concurrency. However, the plateauing effect suggests that there is an optimal number of goroutines beyond which adding more does not lead to further performance gains, and may even introduce overhead.
The 6-core configuration appears to be the most efficient in this scenario, achieving the lowest execution times for a wide range of goroutine counts. This could be due to a better match between the program's concurrency requirements and the available hardware resources on the 6-core system. The 4-core system consistently performs the worst, likely due to its limited ability to handle a large number of concurrent goroutines.