## Log-Log Plot: Model Parameters vs. Tokens Trained
### Overview
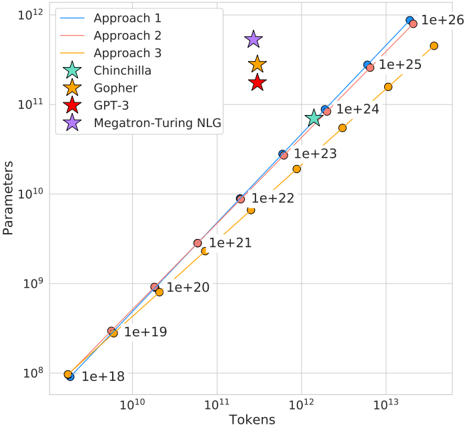
The image is a log-log plot comparing the number of parameters in various language models against the number of tokens they were trained on. The plot includes data for three "Approach" lines and three specific models: Chinchilla, Gopher, GPT-3, and Megatron-Turing NLG. The x-axis represents the number of tokens, and the y-axis represents the number of parameters. Both axes are logarithmically scaled.
### Components/Axes
* **X-axis (Tokens):** Logarithmic scale, ranging from approximately 10^9 to 10^13. Axis markers are present at 10^10, 10^11, 10^12, and 10^13.
* **Y-axis (Parameters):** Logarithmic scale, ranging from approximately 10^8 to 10^12. Axis markers are present at 10^8, 10^9, 10^10, 10^11, and 10^12.
* **Legend (Top-Left):**
* Approach 1 (Light Blue Line)
* Approach 2 (Light Red Line)
* Approach 3 (Orange Line)
* Chinchilla (Light Green Star)
* Gopher (Orange Star)
* GPT-3 (Red Star)
* Megatron-Turing NLG (Purple Star)
### Detailed Analysis
* **Approach 1 (Light Blue Line):** The line slopes upward.
* At 10^9 tokens, the parameters are approximately 1e+18.
* At 10^10 tokens, the parameters are approximately 1e+19.
* At 10^11 tokens, the parameters are approximately 1e+20.
* At 10^12 tokens, the parameters are approximately 1e+23.
* At 10^13 tokens, the parameters are approximately 1e+26.
* **Approach 2 (Light Red Line):** The line slopes upward.
* At 10^9 tokens, the parameters are approximately 1e+18.
* At 10^10 tokens, the parameters are approximately 1e+19.
* At 10^11 tokens, the parameters are approximately 1e+20.
* At 10^12 tokens, the parameters are approximately 1e+22.
* At 10^13 tokens, the parameters are approximately 1e+25.
* **Approach 3 (Orange Line):** The line slopes upward.
* At 10^9 tokens, the parameters are approximately 1e+18.
* At 10^10 tokens, the parameters are approximately 1e+19.
* At 10^11 tokens, the parameters are approximately 1e+20.
* At 10^12 tokens, the parameters are approximately 1e+21.
* At 10^13 tokens, the parameters are approximately 1e+24.
* **Chinchilla (Light Green Star):**
* Located at approximately 10^12 tokens and 1e+24 parameters.
* **Gopher (Orange Star):**
* Located at approximately 10^13 tokens and 1e+25 parameters.
* **GPT-3 (Red Star):**
* Located at approximately 10^13 tokens and 1e+25 parameters.
* **Megatron-Turing NLG (Purple Star):**
* Located at approximately 10^13 tokens and 1e+26 parameters.
### Key Observations
* Approaches 1 and 2 are very similar, with Approach 1 having slightly more parameters for a given number of tokens.
* Approach 3 consistently has fewer parameters for a given number of tokens compared to Approaches 1 and 2.
* The individual models (Chinchilla, Gopher, GPT-3, and Megatron-Turing NLG) are positioned at the higher end of the token scale (10^12 to 10^13) and parameter scale (1e+24 to 1e+26).
* The data points for Chinchilla, Gopher, GPT-3, and Megatron-Turing NLG do not fall directly on the lines of Approaches 1, 2, or 3.
### Interpretation
The plot illustrates the relationship between the size of a language model (number of parameters) and the amount of data it is trained on (number of tokens). The upward-sloping lines suggest a positive correlation: as the number of tokens increases, the number of parameters also tends to increase. The different "Approaches" likely represent different scaling strategies or architectures. The positions of the specific models (Chinchilla, Gopher, GPT-3, and Megatron-Turing NLG) indicate their relative sizes and training data volumes compared to the general trends represented by the "Approach" lines. The fact that these models don't fall directly on the lines suggests that other factors beyond just the number of tokens and parameters influence their performance. The plot highlights the trend of increasing model size and training data in the field of natural language processing.