## Line Chart: Variance Components vs. Iterations
### Overview
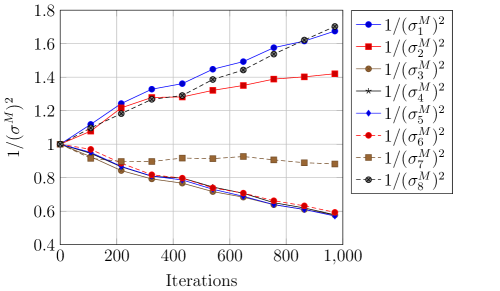
The image is a line chart that plots the inverse of the squared variance components (1/(σ^M)^2) against the number of iterations. There are eight different variance components plotted, each represented by a different colored line with distinct markers. The chart shows how these variance components change over 1000 iterations.
### Components/Axes
* **X-axis:** "Iterations", ranging from 0 to 1000 in increments of 200.
* **Y-axis:** "1/(σ^M)^2", ranging from 0.4 to 1.8 in increments of 0.2.
* **Legend (Top-Right):**
* Blue circles: 1/(σ₁^M)^2
* Red squares: 1/(σ₂^M)^2
* Brown circles: 1/(σ₃^M)^2
* Black stars: 1/(σ₄^M)^2
* Blue diamonds: 1/(σ₅^M)^2
* Red dashed line with circles: 1/(σ₆^M)^2
* Brown dashed line with squares: 1/(σ₇^M)^2
* Black dashed line with circles: 1/(σ₈^M)^2
### Detailed Analysis
* **1/(σ₁^M)^2 (Blue circles):** Starts at approximately 1.0 and increases to approximately 1.7 at 1000 iterations. The trend is upward.
* At 200 iterations: ~1.2
* At 400 iterations: ~1.35
* At 600 iterations: ~1.5
* At 800 iterations: ~1.6
* At 1000 iterations: ~1.7
* **1/(σ₂^M)^2 (Red squares):** Starts at approximately 1.0 and increases to approximately 1.4 at 1000 iterations. The trend is upward.
* At 200 iterations: ~1.1
* At 400 iterations: ~1.3
* At 600 iterations: ~1.4
* At 800 iterations: ~1.4
* At 1000 iterations: ~1.4
* **1/(σ₃^M)^2 (Brown circles):** Starts at approximately 1.0 and decreases to approximately 0.8 at 1000 iterations. The trend is downward.
* At 200 iterations: ~0.95
* At 400 iterations: ~0.9
* At 600 iterations: ~0.8
* At 800 iterations: ~0.7
* At 1000 iterations: ~0.6
* **1/(σ₄^M)^2 (Black stars):** Starts at approximately 1.0 and increases to approximately 1.7 at 1000 iterations. The trend is upward.
* At 200 iterations: ~1.2
* At 400 iterations: ~1.3
* At 600 iterations: ~1.5
* At 800 iterations: ~1.6
* At 1000 iterations: ~1.7
* **1/(σ₅^M)^2 (Blue diamonds):** Starts at approximately 1.0 and decreases to approximately 0.6 at 1000 iterations. The trend is downward.
* At 200 iterations: ~0.9
* At 400 iterations: ~0.8
* At 600 iterations: ~0.7
* At 800 iterations: ~0.65
* At 1000 iterations: ~0.55
* **1/(σ₆^M)^2 (Red dashed line with circles):** Starts at approximately 1.0 and decreases to approximately 0.6 at 1000 iterations. The trend is downward.
* At 200 iterations: ~0.9
* At 400 iterations: ~0.8
* At 600 iterations: ~0.7
* At 800 iterations: ~0.65
* At 1000 iterations: ~0.6
* **1/(σ₇^M)^2 (Brown dashed line with squares):** Starts at approximately 1.0 and decreases slightly before increasing and leveling off at approximately 0.9 at 1000 iterations. The trend is relatively stable after the initial decrease.
* At 200 iterations: ~0.9
* At 400 iterations: ~0.9
* At 600 iterations: ~0.95
* At 800 iterations: ~0.9
* At 1000 iterations: ~0.9
* **1/(σ₈^M)^2 (Black dashed line with circles):** Starts at approximately 1.0 and increases to approximately 1.7 at 1000 iterations. The trend is upward.
* At 200 iterations: ~1.2
* At 400 iterations: ~1.3
* At 600 iterations: ~1.5
* At 800 iterations: ~1.6
* At 1000 iterations: ~1.7
### Key Observations
* Variance components 1, 4, and 8 (blue circles, black stars, and black dashed line with circles, respectively) show a clear increasing trend as the number of iterations increases.
* Variance components 3, 5, and 6 (brown circles, blue diamonds, and red dashed line with circles, respectively) show a clear decreasing trend as the number of iterations increases.
* Variance component 7 (brown dashed line with squares) is relatively stable after an initial decrease.
* Variance component 2 (red squares) increases, but at a slower rate than components 1, 4, and 8.
### Interpretation
The chart illustrates how different variance components behave as the number of iterations increases. Some variance components increase, suggesting they become more significant with more iterations, while others decrease, suggesting they become less significant. The stable variance component indicates that its contribution remains relatively constant throughout the iterations. The data suggests that the iterative process has a varying impact on different variance components, potentially indicating different convergence rates or sensitivities to the iterative algorithm.