## Directed Graph Diagram: Network Flow with Weighted Edges
### Overview
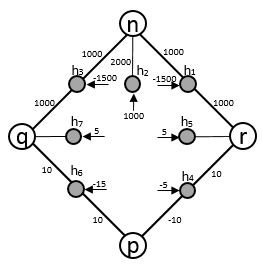
The image depicts a directed graph with labeled nodes and weighted edges. The graph forms a diamond-like structure with additional nodes connected to the main vertices. Edge weights are explicitly labeled, and some nodes (h1–h7) have additional numerical annotations.
### Components/Axes
- **Nodes**:
- Main nodes: `n` (top), `q` (left), `r` (right), `p` (bottom).
- Intermediate nodes: `h1`, `h2`, `h3` (connected to `n`); `h4`, `h5`, `h6`, `h7` (connected to `q`, `r`, and `p`).
- **Edges**:
- Directed arrows with numerical weights (e.g., `1000`, `2000`, `1000`, `10`, `-10`, etc.).
- No legend present; edge weights are directly annotated.
- **Node Annotations**:
- `h1` to `h7` have additional numerical values (e.g., `-1500`, `-15`, `5`, `-5`). These appear to be node-specific attributes rather than edge weights.
### Detailed Analysis
#### Edge Weights
- **Top Layer (`n` connections)**:
- `n → h1`: `1000`
- `n → h2`: `2000`
- `n → h3`: `1000`
- **Middle Layer (`h2` to `q`)**:
- `h2 → q`: `1000`
- **Side Nodes (`q` and `r`)**:
- `q → h4`: `10`
- `q → h6`: `-15`
- `r → h5`: `-5`
- `r → h7`: `5`
- **Bottom Layer (`p` connections)**:
- `p → h4`: `-10`
- `p → h6`: `10`
- `p → h5`: `-5`
- `p → h7`: `10`
#### Node Attributes
- **h1**: `-1500` (left of node)
- **h2**: `-1500` (left of node)
- **h3**: No additional value
- **h4**: `-5` (left of node)
- **h5**: `5` (left of node)
- **h6**: `-15` (left of node)
- **h7**: `5` (left of node)
### Key Observations
1. **Weight Distribution**:
- The largest edge weight is `2000` (from `n` to `h2`), suggesting a critical or high-cost path.
- Negative weights (e.g., `-1500`, `-15`, `-10`) on `h` nodes may represent penalties, costs, or constraints.
2. **Symmetry**:
- The graph is roughly symmetric around the vertical axis (e.g., `q` and `r` have mirrored connections to `h4`, `h5`, `h6`, `h7`).
3. **Negative Values**:
- Nodes `h1`, `h2`, `h4`, `h6`, and `h5` have negative attributes, which could indicate resource drains or inhibitory factors.
### Interpretation
This diagram likely represents a **network flow problem** or **decision tree** with both positive and negative weights. The negative values on `h` nodes suggest they act as "cost centers" or "risk nodes" in the system. For example:
- The high weight (`2000`) from `n` to `h2` might indicate a primary pathway, while the negative attribute (`-1500`) on `h2` could represent a significant cost or penalty associated with that node.
- The symmetry between `q` and `r` implies balanced or mirrored processes, but the asymmetry in edge weights (e.g., `q → h6: -15` vs. `r → h5: -5`) suggests uneven impacts or priorities.
- The bottom layer (`p`) connects to all `h` nodes, possibly acting as a convergence point or final decision node.
### Notable Patterns
- **Critical Path**: The path `n → h2 → q` has the highest cumulative weight (`2000 + 1000 = 3000`), making it a potential focal point.
- **Risk Nodes**: `h1` and `h2` have the largest negative attributes (`-1500`), indicating they may be high-risk or high-cost nodes.
- **Balanced Flow**: The bottom layer (`p`) distributes weights symmetrically to `h4`, `h5`, `h6`, and `h7`, suggesting a stabilizing or balancing role.
This structure could model scenarios like resource allocation, risk assessment, or optimization problems where both gains and losses are quantified.