\n
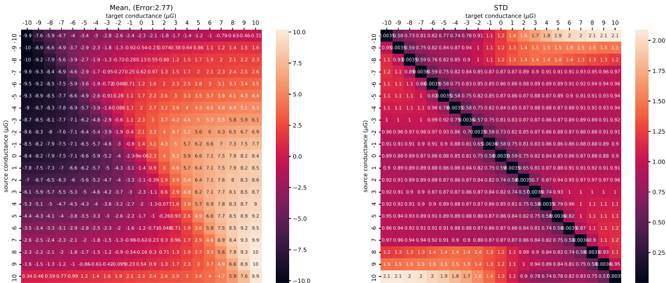
## Heatmaps: Conductance Correlation Analysis
### Overview
The image presents two heatmaps side-by-side, visualizing the correlation between source and target conductance. The left heatmap displays the 'Mean' correlation with an associated error of 2.77, while the right heatmap shows the 'STD' (Standard Deviation) of the correlation. Both heatmaps use a color scale to represent the correlation strength, ranging from approximately -10.0 to 10.0 on both the x and y axes.
### Components/Axes
Both heatmaps share the same structure:
* **X-axis:** Target Conductance (µG), ranging from -10 to 10, with increments of 1.
* **Y-axis:** Source Conductance (µG), ranging from -10 to 10, with increments of 1.
* **Color Scale:** Represents the correlation value.
* Left Heatmap (Mean): Ranges from approximately -10.0 (dark blue) to 10.0 (dark red).
* Right Heatmap (STD): Ranges from approximately -2.21 (dark blue) to 1.75 (dark red).
* **Title:** Left: "Mean, (Error:2.77)". Right: "STD".
### Detailed Analysis or Content Details
**Left Heatmap (Mean):**
The heatmap shows a strong positive correlation along the diagonal, where source and target conductance are equal. Values along the diagonal are approximately between 5.8 and 6.0. As you move away from the diagonal, the correlation decreases, becoming negative in the upper-left and lower-right quadrants.
Here's a sample of data points (approximate values read from the heatmap):
* (-10, -10): ~5.8
* (-10, 10): ~-5.8
* (10, -10): ~-5.8
* (10, 10): ~5.8
* (-5, -5): ~4.8
* (-5, 5): ~-4.8
* (5, -5): ~-4.8
* (5, 5): ~4.8
* (0, 0): ~6.0
* (-2, 2): ~2.3
* (2, -2): ~-2.3
**Right Heatmap (STD):**
This heatmap displays the standard deviation of the correlation. The highest standard deviation values (around 1.75) are concentrated along the diagonal. The standard deviation decreases as you move away from the diagonal, with lower values (around 0.25) in the corners.
Here's a sample of data points (approximate values read from the heatmap):
* (-10, -10): ~1.75
* (-10, 10): ~0.25
* (10, -10): ~0.25
* (10, 10): ~1.75
* (-5, -5): ~1.50
* (-5, 5): ~0.50
* (5, -5): ~0.50
* (5, 5): ~1.50
* (0, 0): ~1.60
* (-2, 2): ~0.75
* (2, -2): ~0.75
### Key Observations
* **Strong Diagonal Correlation:** Both heatmaps exhibit the strongest correlation (positive for Mean, high STD for variability) when source and target conductance are equal.
* **Negative Off-Diagonal Correlation:** The Mean heatmap shows a clear negative correlation when source and target conductance differ significantly.
* **STD Variation:** The STD heatmap indicates that the correlation is most variable when source and target conductance are equal, and less variable when they differ.
* **Symmetry:** Both heatmaps are symmetrical along the diagonal.
### Interpretation
The data suggests a strong relationship between source and target conductance, particularly when they are similar. The positive mean correlation indicates that higher source conductance tends to be associated with higher target conductance, and vice versa. The high standard deviation along the diagonal suggests that while the correlation is strong, there is still considerable variability in the relationship when source and target conductance are equal.
The negative correlation observed off the diagonal implies that when source and target conductance are dissimilar, there's a tendency for one to be high while the other is low. This could be due to underlying physical mechanisms governing conductance, such as limitations in the system or interactions between the source and target.
The STD heatmap provides insight into the reliability of the correlation. The higher STD along the diagonal indicates that the correlation is more consistent when source and target conductance are equal, while the lower STD off the diagonal suggests that the correlation is less predictable in those scenarios. This could be due to the influence of other factors that become more prominent when source and target conductance differ.
The error value of 2.77 associated with the Mean heatmap suggests a level of uncertainty in the estimated mean correlation values. This uncertainty should be considered when interpreting the results.