## Line Chart: Difference MUSHRA Score vs. Intended Angle
### Overview
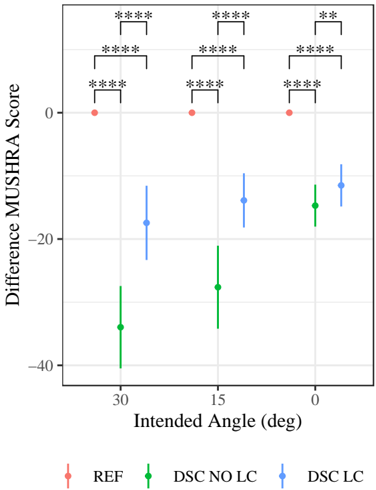
The chart compares the **Difference MUSHRA Score** across three conditions (REF, DSC NO LC, DSC LC) at three **Intended Angles** (30°, 15°, 0°). The y-axis represents the difference in scores, while the x-axis shows the intended angles. Error bars with asterisks indicate statistical significance.
### Components/Axes
- **X-axis (Intended Angle)**: Labeled "Intended Angle (deg)" with values at 30°, 15°, and 0°.
- **Y-axis (Difference MUSHRA Score)**: Labeled "Difference MUSHRA Score" with a range from -40 to 0.
- **Legend**: Located at the bottom, with three categories:
- **Red (REF)**: Reference condition.
- **Green (DSC NO LC)**: DSC without LC.
- **Blue (DSC LC)**: DSC with LC.
- **Error Bars**: Vertical lines with asterisks (*) denoting statistical significance (e.g., *** for p < 0.001).
### Detailed Analysis
- **REF (Red)**:
- All data points are at **0** (no difference).
- Error bars are the longest, with **three asterisks** (*** ) at all angles, indicating high statistical significance.
- **DSC NO LC (Green)**:
- At **30°**: Approximately **-35** (error bar: -40 to -30).
- At **15°**: Approximately **-25** (error bar: -30 to -20).
- At **0°**: Approximately **-20** (error bar: -25 to -15).
- Error bars decrease in length as the angle decreases.
- **DSC LC (Blue)**:
- At **30°**: Approximately **-15** (error bar: -20 to -10).
- At **15°**: Approximately **-10** (error bar: -15 to -5).
- At **0°**: Approximately **-5** (error bar: -10 to 0).
- Error bars are the shortest, with **two asterisks** (** ) at all angles.
### Key Observations
1. **REF** consistently shows **no difference** (0) across all angles, with the largest error bars and highest statistical significance (*** ).
2. **DSC NO LC** exhibits the **largest negative differences**, decreasing in magnitude as the angle decreases (e.g., -35 at 30° to -20 at 0°).
3. **DSC LC** has the **smallest negative differences**, with values approaching 0 as the angle decreases (e.g., -15 at 30° to -5 at 0°).
4. **Statistical significance** decreases from REF (*** ) to DSC LC (** ) as the angle decreases.
### Interpretation
The data suggests that **DSC LC** (with LC) performs better than **DSC NO LC** (without LC), which in turn performs better than the **REF** condition. The **MUSHRA scores** (a measure of perceptual quality) improve as the **intended angle decreases**, with **DSC LC** showing the most consistent improvement. The **error bars** and **asterisks** indicate that the differences are statistically significant, with **REF** having the highest confidence in its results. The trend implies that **LC (likely a technical feature)** reduces perceptual discrepancies, particularly at smaller angles.