# Technical Document Extraction: Compute Optimal Revisions Chart
## 1. Document Metadata
* **Title:** Compute Optimal Revisions
* **Language:** English
* **Image Type:** Line Graph with markers
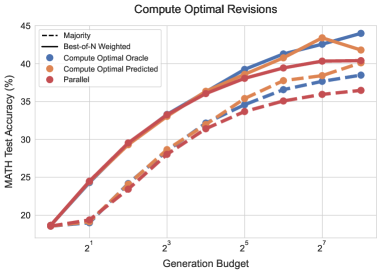
* **Primary Subject:** Performance comparison of different revision strategies across varying generation budgets.
## 2. Component Isolation
### Header
* **Main Title:** Compute Optimal Revisions
### Main Chart Area
* **Y-Axis Label:** MATH Test Accuracy (%)
* **Y-Axis Scale:** Linear, ranging from 15 to 45 with increments of 5.
* **X-Axis Label:** Generation Budget
* **X-Axis Scale:** Logarithmic (Base 2), markers at $2^1, 2^3, 2^5, 2^7$. Data points appear to correspond to powers of 2 from $2^0$ to $2^8$.
* **Grid:** Light gray horizontal and vertical grid lines.
### Legend [Top-Left Placement]
The legend defines two line styles and three color categories:
* **Line Styles:**
* `---` (Dashed): Majority
* `—` (Solid): Best-of-N Weighted
* **Color/Category Markers:**
* ● (Blue): Compute Optimal Oracle
* ● (Orange): Compute Optimal Predicted
* ● (Red): Parallel
## 3. Data Series Analysis and Trend Verification
### Series 1: Best-of-N Weighted (Solid Lines)
* **Trend:** All solid lines show a strong upward logarithmic growth, starting at ~18.5% and plateauing/slowing as they approach the $2^8$ budget.
* **Blue (Oracle):** The highest performing series. Slopes upward consistently, reaching the maximum accuracy of ~44% at $2^8$.
* **Orange (Predicted):** Closely tracks the Oracle line until $2^7$, where it shows a slight dip/fluctuation, ending at ~42%.
* **Red (Parallel):** Follows the same trajectory as the others but remains consistently at the bottom of the solid-line cluster, ending at ~40.5%.
### Series 2: Majority (Dashed Lines)
* **Trend:** These lines also slope upward but are significantly lower in accuracy compared to their "Best-of-N Weighted" counterparts at the same budget levels.
* **Blue (Oracle):** Highest of the dashed lines, ending at ~38.5%.
* **Orange (Predicted):** Tracks closely with the Oracle dashed line, ending at ~40% (notably crossing above the Oracle dashed line at the final data point).
* **Red (Parallel):** The lowest performing series overall, ending at ~36.5%.
## 4. Extracted Data Points (Approximate Values)
| Generation Budget ($2^x$) | Oracle (Solid) | Predicted (Solid) | Parallel (Solid) | Oracle (Dashed) | Predicted (Dashed) | Parallel (Dashed) |
| :--- | :--- | :--- | :--- | :--- | :--- | :--- |
| **$2^0$ (1)** | 18.5% | 18.5% | 18.5% | 18.5% | 18.5% | 18.5% |
| **$2^1$ (2)** | 24.5% | 24.5% | 24.5% | 19.5% | 19.5% | 19.5% |
| **$2^2$ (4)** | 29.5% | 29.5% | 29.5% | 24.0% | 24.0% | 23.5% |
| **$2^3$ (8)** | 33.5% | 33.5% | 33.0% | 28.5% | 28.5% | 28.0% |
| **$2^4$ (16)** | 36.5% | 36.5% | 36.0% | 32.0% | 32.0% | 31.5% |
| **$2^5$ (32)** | 39.5% | 38.5% | 38.0% | 34.5% | 35.5% | 33.5% |
| **$2^6$ (64)** | 41.5% | 41.0% | 39.5% | 36.5% | 38.0% | 35.0% |
| **$2^7$ (128)** | 42.5% | 43.5% | 40.5% | 37.5% | 38.5% | 36.0% |
| **$2^8$ (256)** | 44.0% | 42.0% | 40.5% | 38.5% | 40.0% | 36.5% |
## 5. Key Observations
1. **Method Superiority:** The "Best-of-N Weighted" (solid lines) approach consistently outperforms the "Majority" (dashed lines) approach across all budget levels and categories.
2. **Oracle vs. Predicted:** The "Compute Optimal Predicted" (Orange) method is a very high-fidelity approximation of the "Compute Optimal Oracle" (Blue), often overlapping or staying within 1-2 percentage points.
3. **Parallel Performance:** The "Parallel" (Red) method is consistently the least efficient use of the generation budget compared to the "Compute Optimal" strategies.
4. **Diminishing Returns:** The slope of all lines decreases as the Generation Budget increases, indicating diminishing returns in MATH test accuracy as more compute is applied.