## Bar Chart: Overall Accuracy Comparison of FirstSpDigit and FirstSpace
### Overview
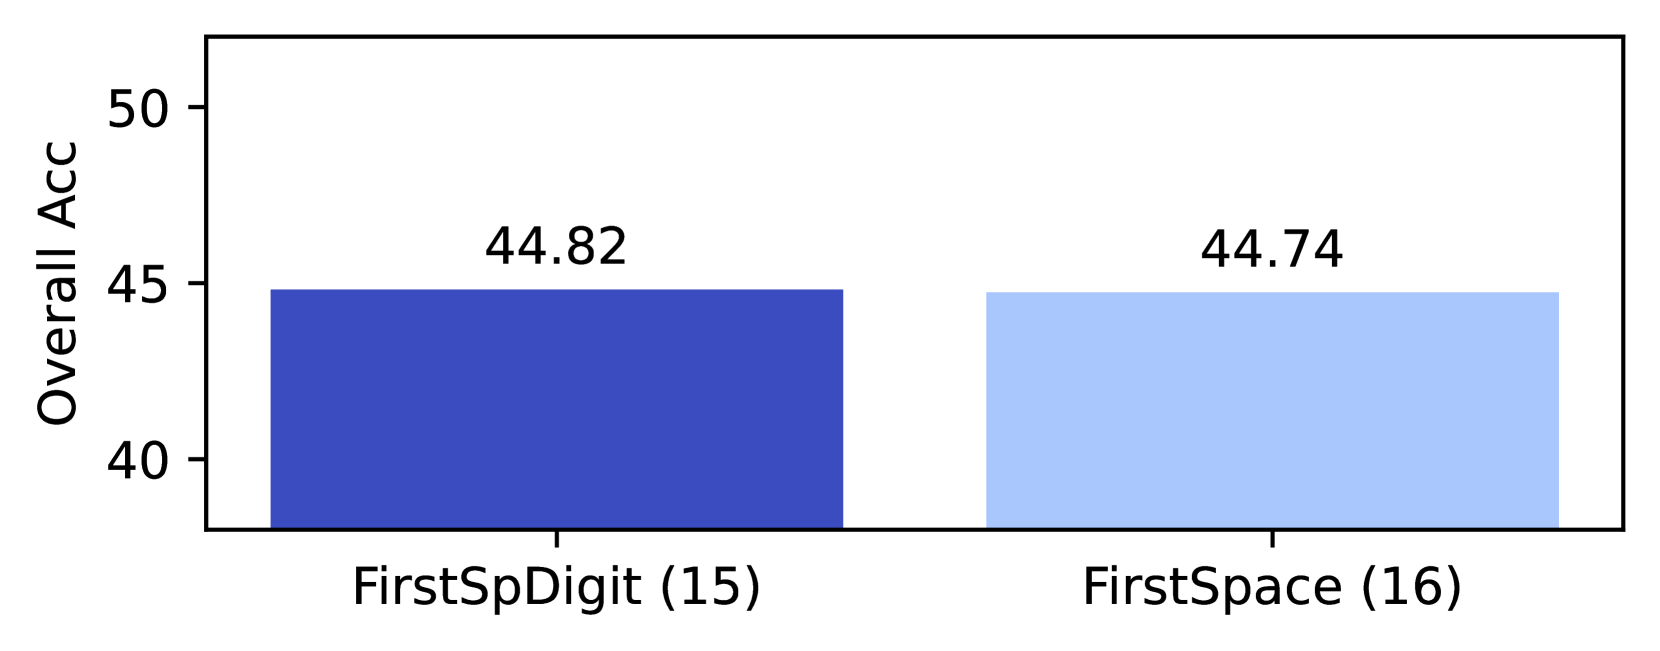
The chart compares the overall accuracy of two categories: "FirstSpDigit (15)" and "FirstSpace (16)". Both categories show nearly identical performance, with "FirstSpDigit" achieving a marginally higher accuracy (44.82) compared to "FirstSpace" (44.74). The y-axis represents "Overall Acc" (accuracy percentage), scaled from 40 to 50 in increments of 5.
### Components/Axes
- **Y-Axis**: Labeled "Overall Acc" (accuracy percentage), ranging from 40 to 50 in steps of 5.
- **X-Axis**: Categories labeled "FirstSpDigit (15)" and "FirstSpace (16)".
- **Legend**: Located on the right side of the chart, associating:
- **Dark Blue** with "FirstSpDigit (15)".
- **Light Blue** with "FirstSpace (16)".
- **Bars**: Two vertical bars, one for each category, positioned side by side.
### Detailed Analysis
- **FirstSpDigit (15)**:
- Accuracy: **44.82** (dark blue bar).
- Position: Leftmost bar, slightly taller than the "FirstSpace" bar.
- **FirstSpace (16)**:
- Accuracy: **44.74** (light blue bar).
- Position: Rightmost bar, marginally shorter than "FirstSpDigit".
### Key Observations
1. The accuracies of both categories are extremely close, differing by only **0.08%**.
2. "FirstSpDigit" outperforms "FirstSpace" by a negligible margin, suggesting minimal practical difference in performance.
3. No error bars or confidence intervals are visible, implying the values are presented as exact measurements.
### Interpretation
The chart demonstrates that "FirstSpDigit" and "FirstSpace" achieve nearly identical overall accuracy, with "FirstSpDigit" holding a trivial advantage. This could imply that the underlying systems or algorithms for processing digits and spaces are similarly robust, though the slight edge for digits might reflect inherent differences in data structure (e.g., digits being more distinct than spaces). The absence of error margins limits conclusions about statistical significance, but the visual parity suggests comparable reliability across both categories.