\n
## Charts: Effect of Edge Pruning on Model Performance
### Overview
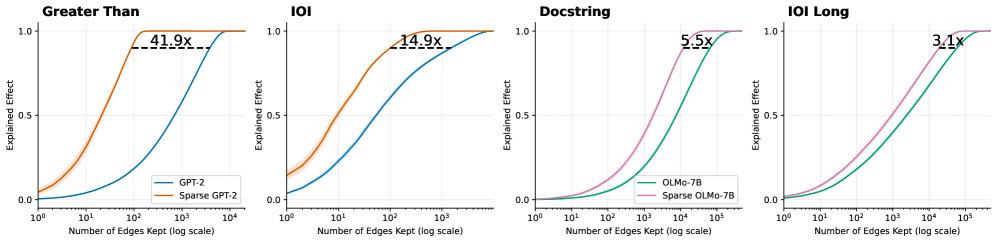
The image presents four separate charts, each depicting the relationship between the number of edges kept (on a logarithmic scale) and the explained effect for different model configurations. Each chart focuses on a different pruning target: "Greater Than", "IOI", "Docstring", and "IOI Long". Each chart compares the performance of a dense model (GPT-2 or OLMo-7B) against a sparse version of the same model. The explained effect is a measure of how well the model performs, ranging from 0 to 1.
### Components/Axes
Each chart shares the following components:
* **X-axis:** "Number of Edges Kept (log scale)". The scale ranges from 10<sup>1</sup> to 10<sup>5</sup>.
* **Y-axis:** "Explained Effect". The scale ranges from 0.0 to 1.0.
* **Title:** Each chart has a title indicating the pruning target ("Greater Than", "IOI", "Docstring", "IOI Long").
* **Legend:** Each chart has a legend identifying the two data series: a dense model and a sparse model.
* **Data Series:** Each chart contains two lines representing the explained effect for the dense and sparse models.
The specific models used in each chart are:
* **"Greater Than" Chart:** GPT-2 (blue line), Sparse GPT-2 (orange line).
* **"IOI" Chart:** GPT-2 (blue line), Sparse GPT-2 (orange line).
* **"Docstring" Chart:** OLMo-7B (pink line), Sparse OLMo-7B (teal line).
* **"IOI Long" Chart:** OLMo-7B (pink line), Sparse OLMo-7B (teal line).
Each chart also displays a text label indicating the compression ratio achieved by the sparse model, e.g., "41.9x".
### Detailed Analysis
**"Greater Than" Chart:**
* The blue line (GPT-2) starts at approximately 0.15 at 10<sup>1</sup> edges and quickly rises to approximately 0.95 at 10<sup>3</sup> edges, then plateaus.
* The orange line (Sparse GPT-2) starts at approximately 0.05 at 10<sup>1</sup> edges, rises more gradually than the blue line, reaching approximately 0.85 at 10<sup>3</sup> edges, and then plateaus.
* Compression ratio: 41.9x
**"IOI" Chart:**
* The blue line (GPT-2) starts at approximately 0.1 at 10<sup>1</sup> edges and rises rapidly to approximately 0.95 at 10<sup>3</sup> edges, then plateaus.
* The orange line (Sparse GPT-2) starts at approximately 0.05 at 10<sup>1</sup> edges, rises more gradually, reaching approximately 0.8 at 10<sup>3</sup> edges, and then plateaus.
* Compression ratio: 14.9x
**"Docstring" Chart:**
* The pink line (OLMo-7B) starts at approximately 0.1 at 10<sup>1</sup> edges and rises rapidly to approximately 0.95 at 10<sup>4</sup> edges, then plateaus.
* The teal line (Sparse OLMo-7B) starts at approximately 0.05 at 10<sup>1</sup> edges, rises more gradually, reaching approximately 0.85 at 10<sup>4</sup> edges, and then plateaus.
* Compression ratio: 5.5x
**"IOI Long" Chart:**
* The pink line (OLMo-7B) starts at approximately 0.05 at 10<sup>1</sup> edges and rises gradually to approximately 0.9 at 10<sup>5</sup> edges.
* The teal line (Sparse OLMo-7B) starts at approximately 0.02 at 10<sup>1</sup> edges and rises more gradually, reaching approximately 0.75 at 10<sup>5</sup> edges.
* Compression ratio: 3.1x
### Key Observations
* In all charts, the sparse models consistently underperform the dense models, but achieve significant compression.
* The compression ratio varies depending on the pruning target. "Greater Than" achieves the highest compression (41.9x), while "IOI Long" achieves the lowest (3.1x).
* The "IOI Long" chart shows the slowest rise in explained effect for both models, indicating that this pruning target is the most challenging to maintain performance on.
* The sparse models exhibit a more gradual increase in explained effect as the number of edges kept increases, suggesting that they are more sensitive to edge pruning.
### Interpretation
These charts demonstrate the trade-off between model performance and compression achieved through edge pruning. Pruning edges reduces the model size (and thus computational cost) but also reduces the model's ability to explain the data. The compression ratio indicates how much smaller the sparse model is compared to the dense model.
The varying compression ratios across different pruning targets suggest that some targets are more amenable to pruning than others. "Greater Than" appears to be the most effective pruning target, as it allows for the highest compression with a relatively small performance loss. "IOI Long" is the least effective, requiring a significantly larger number of edges to achieve comparable performance.
The slower rise in explained effect for the "IOI Long" target suggests that this target captures more complex relationships in the data, which are more difficult to approximate with a sparse model. This implies that the "IOI Long" target may be more important for maintaining model accuracy, even at the cost of compression.
The consistent underperformance of the sparse models highlights the importance of carefully evaluating the trade-off between performance and compression when applying edge pruning techniques. The optimal pruning strategy will depend on the specific application and the desired balance between these two factors.