## Line Chart: Validation Loss Difference vs. Tokens Trained
### Overview
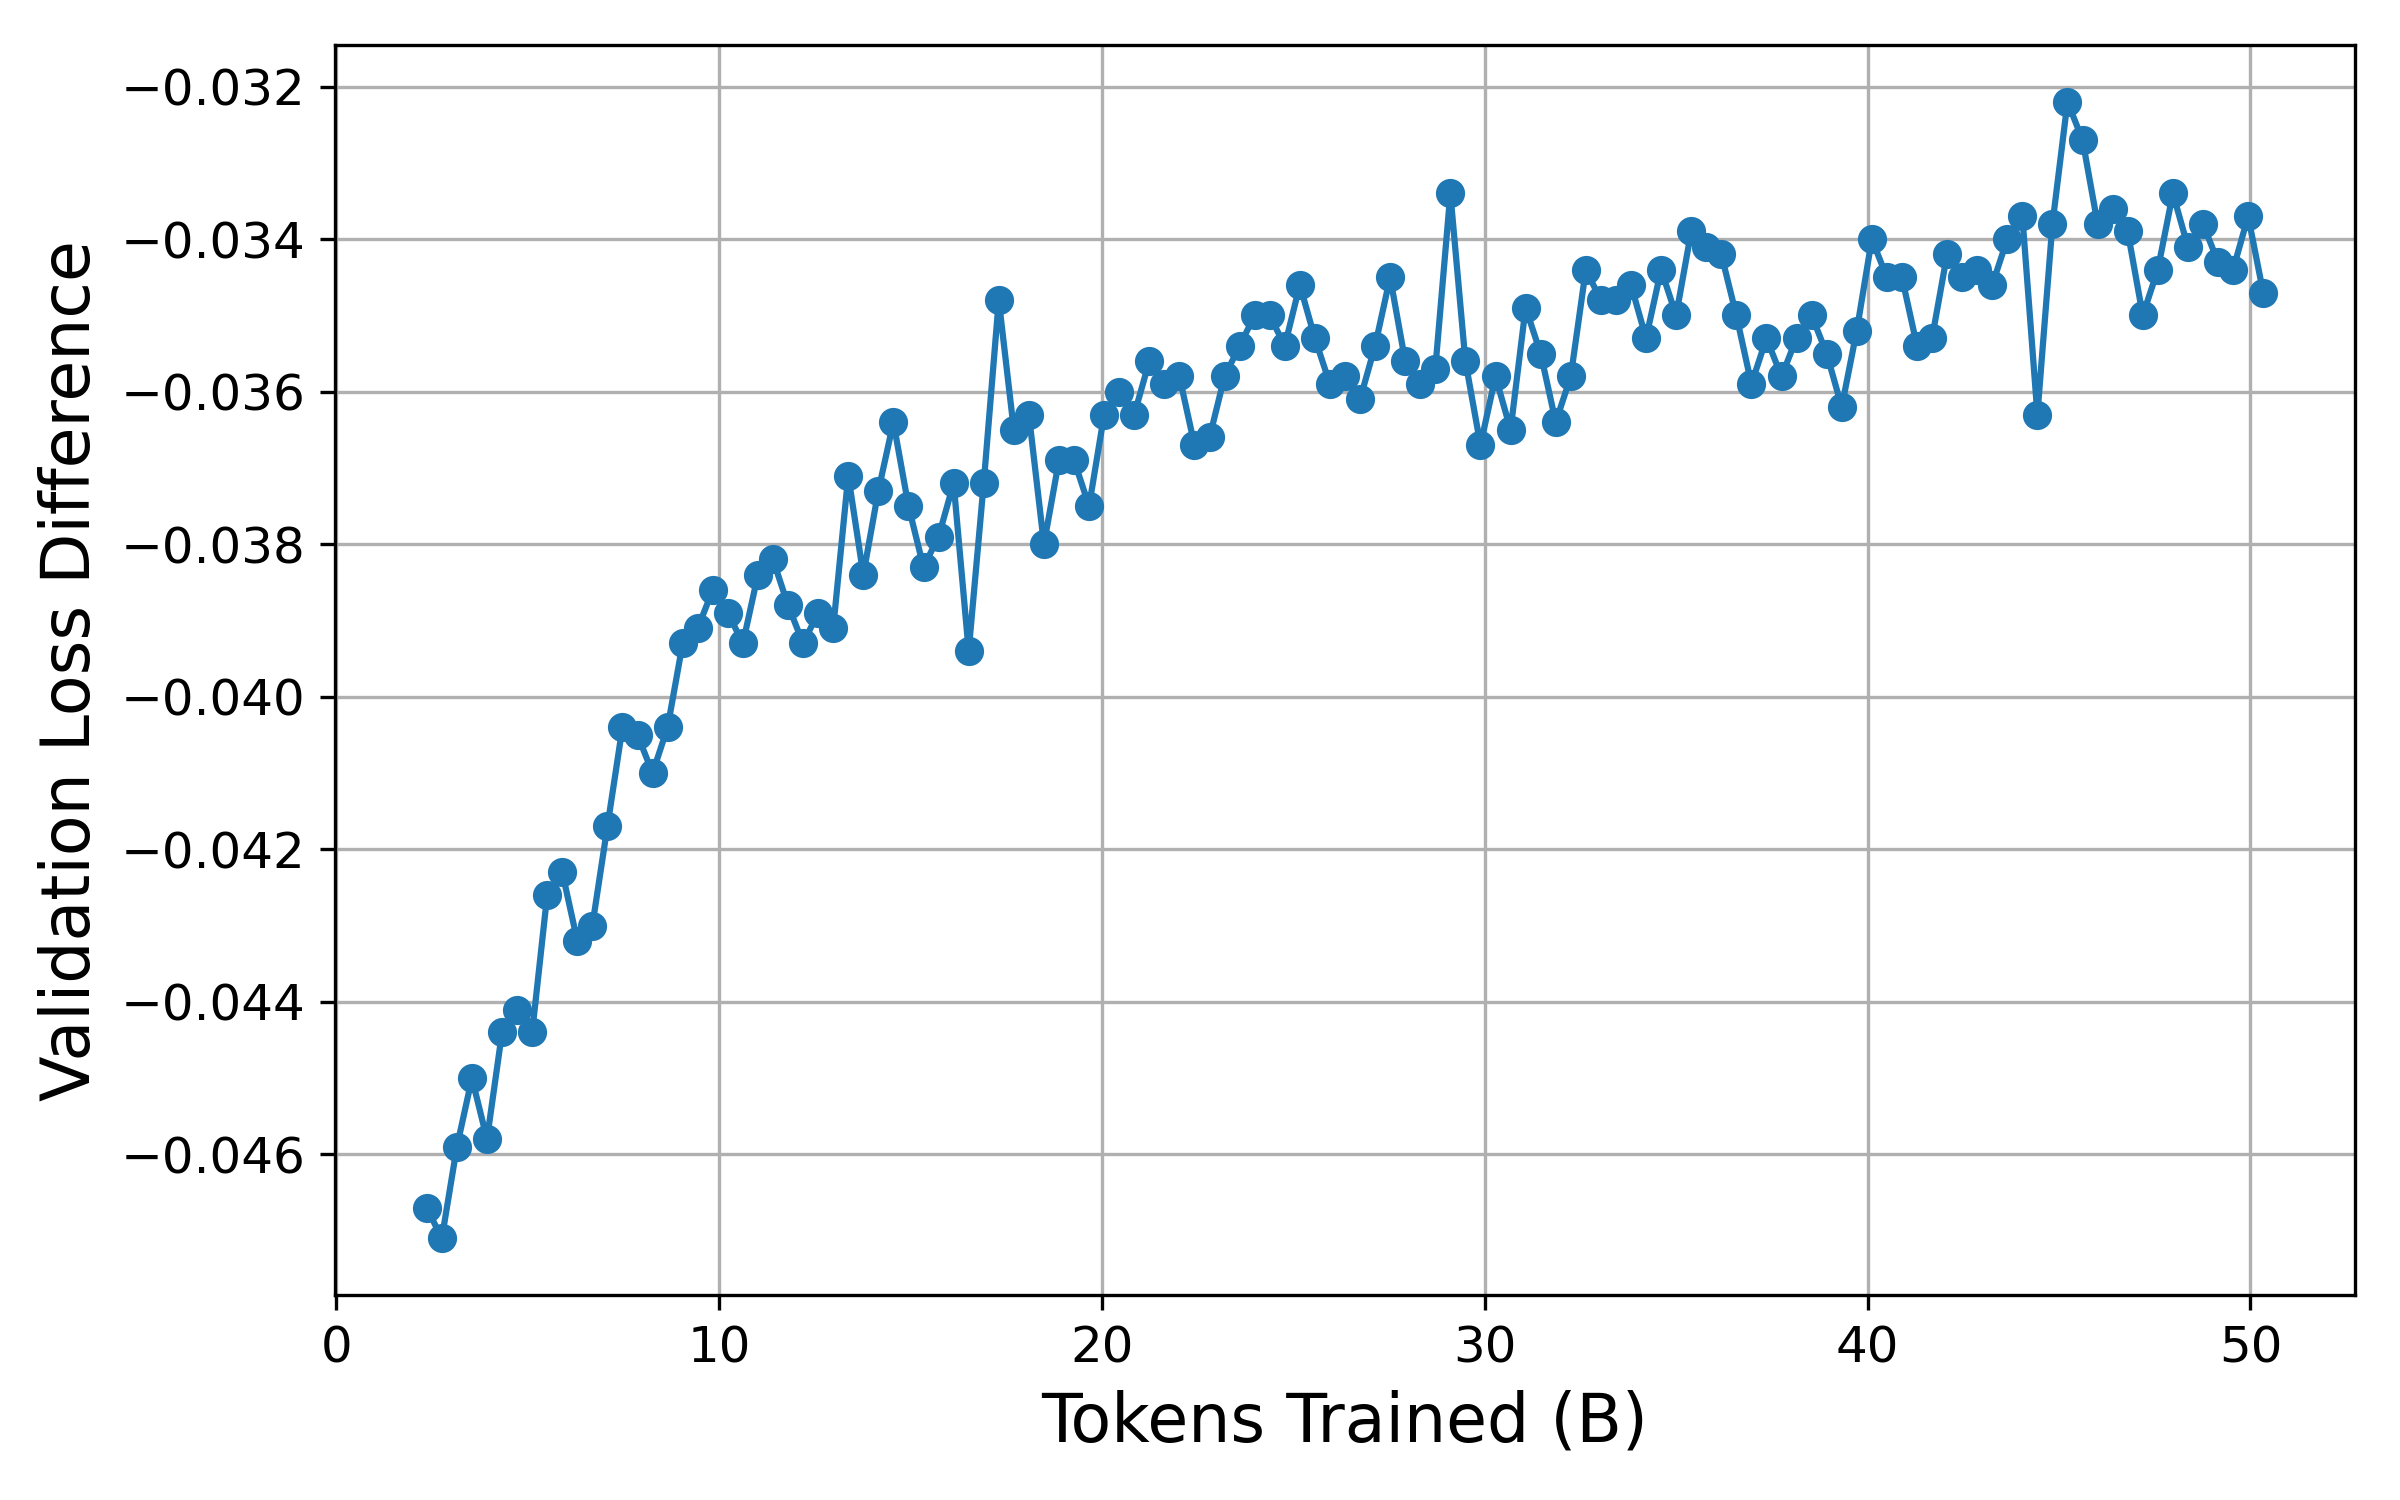
The image displays a line chart illustrating the relationship between the number of tokens trained (in billions) and the "Validation Loss Difference." The chart shows a single data series represented by a blue line with circular markers, indicating a clear upward trend (moving from more negative to less negative values) as the number of tokens increases.
### Components/Axes
* **X-Axis:** Labeled "Tokens Trained (B)". The scale ranges from 0 to 50, with major grid lines at intervals of 10.
* **Y-Axis:** Labeled "Validation Loss Difference". The scale ranges from -0.046 to -0.032, with major grid lines at intervals of 0.002.
* **Data Series:** A single blue line connecting circular data points, representing the performance metric over the training duration.
* **Grid:** A light gray grid is overlaid on the plot area to facilitate reading values.
### Detailed Analysis
The data series exhibits a distinct logarithmic-style growth curve, characterized by rapid initial improvement followed by a plateau.
* **Trend Verification:**
* **0B to 15B Tokens:** The curve shows a steep, consistent upward slope. The value rises from approximately -0.047 to -0.037.
* **15B to 50B Tokens:** The slope flattens significantly, indicating diminishing returns. The values oscillate within a tighter band, generally between -0.037 and -0.034.
* **Data Point Approximations:**
* **Start (~2B):** The series begins at approximately -0.047.
* **10B:** The value is approximately -0.039.
* **20B:** The value is approximately -0.037.
* **30B:** The value is approximately -0.036.
* **40B:** The value is approximately -0.035.
* **50B:** The value is approximately -0.035.
### Key Observations
* **Diminishing Returns:** The most significant gains in the "Validation Loss Difference" occur within the first 15 billion tokens. After this point, the rate of improvement slows drastically.
* **Stochastic Noise:** The line is not smooth; it exhibits frequent, high-frequency fluctuations (jitter) throughout the entire training process. This is typical of stochastic gradient descent or batch-level training metrics.
* **Notable Outliers:**
* There is a distinct upward spike around 29B tokens, where the value briefly reaches approximately -0.033.
* There is a notable dip around 45B tokens, where the value drops to approximately -0.036.
### Interpretation
* **Performance Metric:** The data represents a learning curve for a machine learning model. Assuming "Validation Loss Difference" is calculated as `(Baseline Loss - Current Model Loss)` or a similar comparative metric, the upward trend indicates that the model is improving as it consumes more training data.
* **Training Dynamics:** The transition from a steep slope to a plateau suggests that the model has reached a point of saturation where additional training tokens provide marginal improvements.
* **Stability:** The persistent "jitter" in the line suggests that the training process is noisy. This could be due to the batch size, the learning rate, or the inherent variance in the validation dataset.
* **Conclusion:** The model benefits significantly from the first 15B tokens of training. Beyond 20B tokens, the training process enters a phase of refinement where the gains are incremental and subject to higher volatility.