## Bar Chart: Performance Comparison of VideoLLaMA3-7B and RynnEC-7B
### Overview
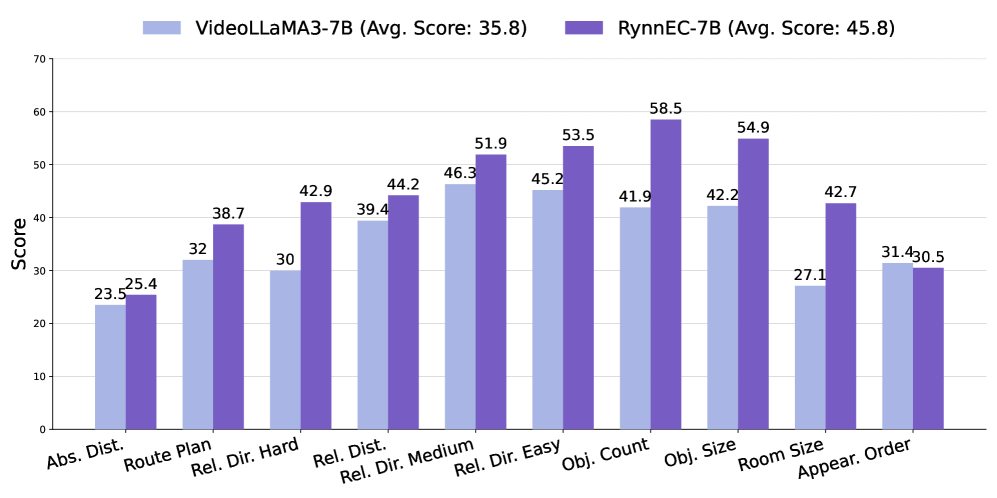
This bar chart compares the performance scores of two models, VideoLLaMA3-7B and RynnEC-7B, across several categories related to spatial reasoning and scene understanding. The chart displays the average score for each model on each category.
### Components/Axes
* **X-axis:** Categories - "Abs. Dist.", "Route Plan", "Rel. Dir. Hard", "Rel. Dist.", "Rel. Dir. Medium", "Rel. Dir. Easy", "Obj. Count", "Obj. Size", "Room Size", "Appear. Order".
* **Y-axis:** Score - ranging from 0 to 70.
* **Models:**
* VideoLLaMA3-7B (represented by a light purple color) with an average score of 35.8.
* RynnEC-7B (represented by a dark purple color) with an average score of 45.8.
* **Legend:** Located at the top of the chart, clearly indicating the color correspondence for each model.
### Detailed Analysis
The chart consists of 10 pairs of bars, one for each model per category. The values are as follows:
* **Abs. Dist. (Absolute Distance):** VideoLLaMA3-7B: 23.5, RynnEC-7B: 25.4
* **Route Plan:** VideoLLaMA3-7B: 25.4, RynnEC-7B: 32.0
* **Rel. Dir. Hard (Relative Direction - Hard):** VideoLLaMA3-7B: 38.7, RynnEC-7B: 30.0
* **Rel. Dist. (Relative Distance):** VideoLLaMA3-7B: 42.9, RynnEC-7B: 39.4
* **Rel. Dir. Medium (Relative Direction - Medium):** VideoLLaMA3-7B: 44.2, RynnEC-7B: 46.3
* **Rel. Dir. Easy (Relative Direction - Easy):** VideoLLaMA3-7B: 51.9, RynnEC-7B: 45.2
* **Obj. Count (Object Count):** VideoLLaMA3-7B: 53.5, RynnEC-7B: 41.9
* **Obj. Size (Object Size):** VideoLLaMA3-7B: 58.5, RynnEC-7B: 42.2
* **Room Size:** VideoLLaMA3-7B: 54.9, RynnEC-7B: 27.1
* **Appear. Order (Appearance Order):** VideoLLaMA3-7B: 42.7, RynnEC-7B: 31.4
**Trends:**
* RynnEC-7B generally outperforms VideoLLaMA3-7B across most categories.
* The performance gap between the two models is most significant in "Obj. Count", "Obj. Size", and "Room Size".
* VideoLLaMA3-7B performs better than RynnEC-7B in "Rel. Dir. Hard".
### Key Observations
* RynnEC-7B consistently achieves higher scores, indicating superior performance overall.
* The largest performance difference is observed in "Room Size", where RynnEC-7B scores significantly lower than VideoLLaMA3-7B. This could indicate a weakness in RynnEC-7B's ability to estimate or understand room dimensions.
* The "Rel. Dir. Hard" category is an outlier, where VideoLLaMA3-7B outperforms RynnEC-7B.
### Interpretation
The data suggests that RynnEC-7B is a more robust model for spatial reasoning and scene understanding tasks, as evidenced by its consistently higher scores across most categories. The models are being evaluated on their ability to understand spatial relationships, object properties, and scene layouts. The significant difference in performance on "Obj. Count", "Obj. Size", and "Room Size" suggests that RynnEC-7B may have a better understanding of object characteristics and spatial configurations. The outlier in "Rel. Dir. Hard" could indicate a specific strength of VideoLLaMA3-7B in handling complex directional reasoning or a weakness of RynnEC-7B in this particular area. The average scores provided at the top of the legend (35.8 and 45.8) confirm the overall trend of RynnEC-7B outperforming VideoLLaMA3-7B. The chart provides a clear quantitative comparison of the two models' capabilities, highlighting their strengths and weaknesses in different aspects of spatial understanding.