## Diagram: Hierarchical Audio Generation Process
### Overview
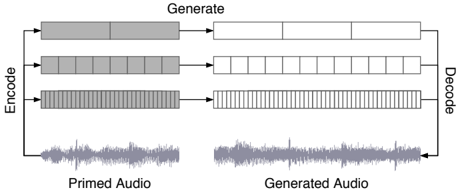
This diagram illustrates a multi-scale, hierarchical audio generation process. It depicts how input audio ("Primed Audio") is encoded into discrete representations at varying levels of granularity, transformed through a generation process, and subsequently decoded back into an audio waveform ("Generated Audio"). The diagram highlights a feedback loop, suggesting an autoregressive or iterative generation mechanism.
### Components/Axes
* **Top Center:** "Generate" (Label indicating the transformation process from grey to white blocks).
* **Left Side:** "Encode" (Vertical label with a bracket encompassing the three rows of grey blocks).
* **Right Side:** "Decode" (Vertical label with a bracket encompassing the three rows of white blocks).
* **Bottom Left:** "Primed Audio" (Label for the input waveform).
* **Bottom Right:** "Generated Audio" (Label for the output waveform).
* **Visual Elements:**
* **Grey Blocks (Left):** Represent the encoded state of the primed audio.
* **White Blocks (Right):** Represent the generated state of the audio.
* **Waveforms:** Visual representations of audio signals at the bottom.
* **Arrows:** Indicate the flow of data from input to output, and a feedback loop from output back to input.
### Detailed Analysis
The diagram is structured into three distinct horizontal rows, representing different levels of temporal resolution or semantic hierarchy:
* **Row 1 (Top):**
* **Input (Grey):** 2 blocks.
* **Output (White):** 3 blocks.
* **Trend:** Represents the coarsest level of representation.
* **Row 2 (Middle):**
* **Input (Grey):** 8 blocks.
* **Output (White):** 9 blocks.
* **Trend:** Represents an intermediate level of detail.
* **Row 3 (Bottom):**
* **Input (Grey):** High density (approx. 30+ blocks).
* **Output (White):** High density (approx. 30+ blocks).
* **Trend:** Represents the finest level of detail (likely sample-level or high-resolution acoustic features).
**Flow and Connectivity:**
1. **Input:** The "Primed Audio" waveform is processed by the "Encode" stage, resulting in the three rows of grey blocks.
2. **Transformation:** The "Generate" process maps the grey blocks to the white blocks across all three hierarchical levels.
3. **Output:** The "Decode" stage converts the white blocks into the "Generated Audio" waveform.
4. **Feedback Loop:** A line connects the "Generated Audio" back to the input of the "Encode" stage, indicating that the output is fed back into the system, likely to continue the generation process (autoregression).
### Key Observations
* **Hierarchical Granularity:** The diagram explicitly demonstrates a "coarse-to-fine" or "multi-scale" approach. The top row has the fewest blocks, while the bottom row has the most, suggesting the model processes audio at different temporal resolutions simultaneously.
* **Feedback Mechanism:** The loop-back arrow is critical; it implies that the generation is not a single-pass operation but an iterative one where the model conditions its next step on its previous output.
* **Symmetry:** The "Encode" and "Decode" processes are visually symmetrical, suggesting a standard encoder-decoder architecture (such as a VQ-VAE or similar neural audio codec).
### Interpretation
This diagram represents the architecture of a **hierarchical neural audio generation model** (similar to AudioLM or SoundStream).
* **Why it matters:** By breaking audio into hierarchical levels (coarse to fine), the model can capture long-term structure (the top rows) and fine-grained acoustic detail (the bottom row) more efficiently than processing raw audio samples directly.
* **Reading between the lines:** The feedback loop indicates this is an **autoregressive model**. The system generates a small chunk of audio, appends it to the "Primed Audio," and feeds it back into the encoder to generate the next chunk. This is the standard mechanism for generating long-form, coherent audio (like speech or music) where the model must "remember" what it just generated to maintain consistency. The discrepancy in block counts between the grey and white rows (e.g., 2 vs 3) suggests the model may be performing upsampling or temporal expansion during the generation phase.