## Line Graph: Accuracy Progression Over Iterations
### Overview
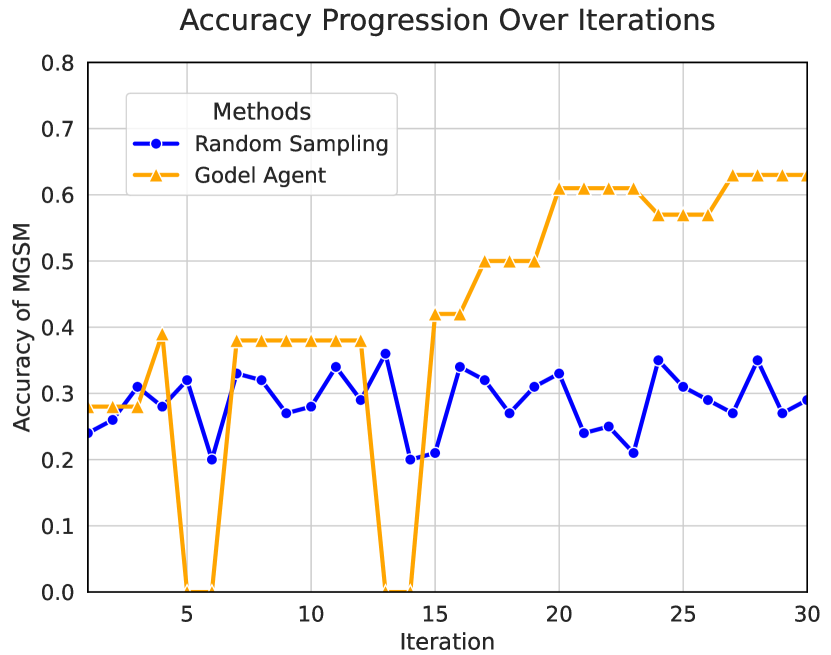
The graph compares the accuracy progression of two methods—Random Sampling and Godel Agent—over 30 iterations. Accuracy is measured on the y-axis (0.0 to 0.8), and iterations are plotted on the x-axis (0 to 30). Two distinct lines represent the methods: blue circles for Random Sampling and orange triangles for Godel Agent.
### Components/Axes
- **Title**: "Accuracy Progression Over Iterations"
- **X-axis**: Labeled "Iteration," with increments of 5 (0, 5, 10, ..., 30).
- **Y-axis**: Labeled "Accuracy of MSSM," with increments of 0.1 (0.0, 0.1, ..., 0.8).
- **Legend**: Located in the top-left corner, with:
- Blue circles: "Random Sampling"
- Orange triangles: "Godel Agent"
### Detailed Analysis
#### Random Sampling (Blue Line)
- **Trend**: Fluctuates between ~0.2 and ~0.35, with no clear upward or downward trajectory.
- **Key Points**:
- Iteration 0: ~0.25
- Iteration 5: ~0.32
- Iteration 10: ~0.28
- Iteration 15: ~0.34
- Iteration 20: ~0.32
- Iteration 25: ~0.30
- Iteration 30: ~0.29
#### Godel Agent (Orange Line)
- **Trend**: Shows significant volatility early on, stabilizing at ~0.6 after iteration 20.
- **Key Points**:
- Iteration 0: ~0.28
- Iteration 5: ~0.0 (sharp drop)
- Iteration 10: ~0.38
- Iteration 15: ~0.42
- Iteration 20: ~0.62 (sharp rise)
- Iteration 25: ~0.57
- Iteration 30: ~0.63
### Key Observations
1. **Godel Agent** exhibits higher accuracy than Random Sampling after iteration 20, maintaining ~0.6 accuracy.
2. **Random Sampling** remains relatively stable but underperforms compared to Godel Agent in later iterations.
3. **Anomalies**:
- Godel Agent’s accuracy drops to 0.0 at iteration 5, suggesting a potential outlier or error.
- Both methods show minor fluctuations, but Godel Agent’s volatility decreases after iteration 15.
### Interpretation
The data suggests that the Godel Agent method outperforms Random Sampling in terms of accuracy as iterations increase, particularly after iteration 20. The sharp drop in Godel Agent’s accuracy at iteration 5 may indicate a transient instability or a miscalculation in that specific iteration. Random Sampling’s consistent but lower accuracy implies it may be less effective for this task over time. The divergence between the two methods highlights the potential advantages of the Godel Agent approach for improving accuracy in iterative processes.