## Diagram: Input Transformation with Priority
### Overview
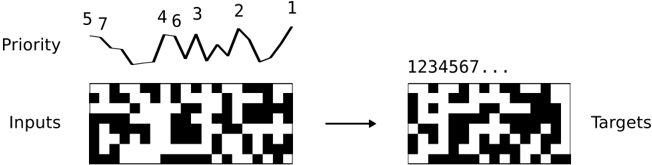
The image illustrates a transformation process where an input matrix is converted into a target matrix based on a priority system. The priority is represented by a line graph above the input matrix, with numerical labels indicating the priority order. The transformation from input to target is visually indicated by an arrow.
### Components/Axes
* **Priority:** A line graph indicating the priority of transformation. The x-axis is implicitly the order of transformation (1 to 7). The y-axis represents the priority level.
* **Inputs:** A black and white matrix representing the initial state.
* **Targets:** A black and white matrix representing the final state after transformation.
* **Arrow:** An arrow pointing from the "Inputs" matrix to the "Targets" matrix, indicating the direction of the transformation.
* **Numerical Labels:** Numbers 1 through 7 are placed above the priority line, indicating the order of priority.
### Detailed Analysis
* **Priority Line Graph:**
* The line graph starts at priority 5, then goes to 7, then drops to 4, then rises to 6, then drops to 3, then rises to 2, and finally rises to 1.
* The priority order is explicitly labeled as 1, 2, 3, 4, 5, 6, 7.
* **Input Matrix:**
* The input matrix is a 7x7 grid of black and white squares.
* The arrangement of black and white squares appears random.
* **Target Matrix:**
* The target matrix is also a 7x7 grid of black and white squares.
* The arrangement of black and white squares is different from the input matrix, indicating a transformation.
* The numbers 1234567... are written above the target matrix.
* **Transformation Arrow:**
* The arrow indicates the transformation process from the input matrix to the target matrix.
### Key Observations
* The priority line graph suggests that the transformation process is not sequential but rather based on a specific order of priority.
* The input and target matrices are different, indicating that a transformation has occurred.
* The numbers above the target matrix likely correspond to the priority order used in the transformation.
### Interpretation
The diagram illustrates a process where an input matrix is transformed into a target matrix based on a defined priority. The priority line graph dictates the order in which elements of the input matrix are processed to generate the target matrix. The specific algorithm or method used for the transformation is not explicitly defined, but the diagram suggests that it is influenced by the priority order. The black and white matrices could represent binary data, pixel values, or any other discrete information. The transformation could represent a sorting, filtering, or re-arrangement process based on the priority assigned to each element.