## Diagram: Priority-Driven Input Transformation to Ordered Targets
### Overview
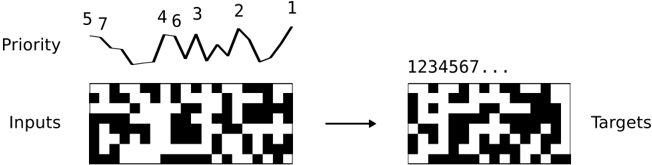
The image depicts a two-stage process involving a priority sequence and binary grid transformations. A zigzag "Priority" line graph (top) maps to an "Inputs" grid (left) and a "Targets" grid (right), connected by an arrow indicating transformation. The Priority line fluctuates between values 5, 7, 4, 6, 3, 2, and 1, while the grids use black/white cells to encode data.
---
### Components/Axes
1. **Priority Section (Top)**
- **X-axis**: Discrete steps labeled `5`, `7`, `4`, `6`, `3`, `2`, `1` (left to right).
- **Y-axis**: Labeled "Priority" (no scale, qualitative).
- **Line**: Black, zigzag pattern connecting points at each X-axis step. Peaks at `7` (step 2) and `6` (step 4), troughs at `1` (step 7).
2. **Grids (Bottom)**
- **Inputs Grid (Left)**
- 8x8 binary grid (black/white cells).
- Complex, irregular patterns with no obvious numerical labels.
- **Targets Grid (Right)**
- 8x8 binary grid with a structured sequence.
- Top row labeled `1234567...` (horizontal progression).
- Cells below align with the sequence, suggesting ordered encoding.
3. **Arrow**
- Black arrow pointing from Inputs grid to Targets grid, indicating transformation.
---
### Detailed Analysis
1. **Priority Line Trends**
- The Priority line decreases overall from `5` (step 1) to `1` (step 7), with intermediate fluctuations:
- Step 1: `5` → Step 2: `7` (peak)
- Step 3: `4` → Step 4: `6` (peak)
- Step 5: `3` → Step 6: `2` → Step 7: `1` (final trough).
- Suggests dynamic priority adjustments, with temporary increases before final descent.
2. **Grids**
- **Inputs Grid**: Appears to encode raw data or initial state. Black cells form irregular clusters, possibly representing unstructured input.
- **Targets Grid**: Structured output with sequential numbering (`1234567...`). Black cells align with the sequence, implying prioritized or sorted data.
3. **Transformation Logic**
- The Priority line’s fluctuations likely dictate how Inputs are reordered into Targets. For example:
- Higher priority values (e.g., `7`, `6`) may correspond to earlier positions in the Targets grid.
- The final priority value (`1`) aligns with the last position in the Targets sequence.
---
### Key Observations
1. **Priority-Output Correlation**
- The Priority line’s final value (`1`) matches the last number in the Targets grid’s top row, suggesting a direct relationship between priority ranking and output order.
2. **Grid Complexity**
- Inputs grid’s irregularity vs. Targets grid’s order implies a filtering/sorting mechanism driven by the Priority sequence.
3. **Step Count Mismatch**
- Priority line has 7 steps, while grids are 8x8. Possible explanation: Step 0 (unlabeled) or padding in the grids.
---
### Interpretation
This diagram illustrates a **priority-driven data transformation process**:
1. **Priority Sequence**: The zigzag line represents dynamic adjustments in task/element importance over discrete steps. The final priority (`1`) acts as the "highest" target.
2. **Input-to-Target Mapping**: The Inputs grid’s chaotic structure is reorganized into the Targets grid’s ordered sequence, likely using the Priority line as a sorting key.
3. **Applications**: Could model algorithms for task scheduling, data prioritization, or neural network attention mechanisms where priority weights guide output generation.
**Notable Anomaly**: The Priority line’s intermediate peaks (`7`, `6`) suggest temporary prioritization of lower-ranked elements before final resolution. This might reflect iterative refinement in a computational process.