## Bar Chart: Multiplier: Time vs Core count
### Overview
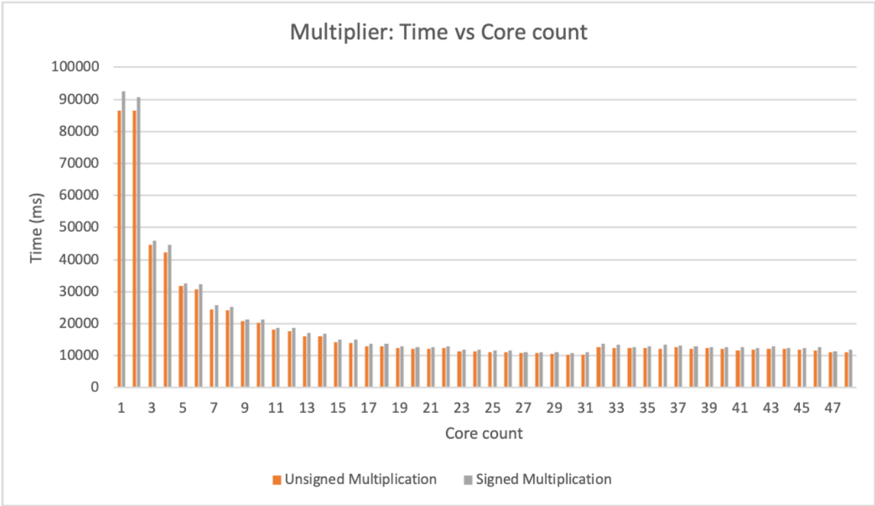
The image is a bar chart comparing the execution time (in milliseconds) of unsigned and signed multiplication operations against the number of cores used (Core count). The chart displays two data series: "Unsigned Multiplication" (orange bars) and "Signed Multiplication" (gray bars). The x-axis represents the core count, ranging from 1 to 47. The y-axis represents the time in milliseconds, ranging from 0 to 100,000.
### Components/Axes
* **Title:** Multiplier: Time vs Core count
* **X-axis:**
* Label: Core count
* Scale: 1, 3, 5, 7, 9, 11, 13, 15, 17, 19, 21, 23, 25, 27, 29, 31, 33, 35, 37, 39, 41, 43, 45, 47
* **Y-axis:**
* Label: Time (ms)
* Scale: 0, 10000, 20000, 30000, 40000, 50000, 60000, 70000, 80000, 90000, 100000
* **Legend:** Located at the bottom of the chart.
* Unsigned Multiplication: Orange bars
* Signed Multiplication: Gray bars
### Detailed Analysis
**Unsigned Multiplication (Orange Bars):**
* **Trend:** The execution time decreases rapidly from 1 core to approximately 11 cores, then gradually decreases until around 31 cores, after which it stabilizes.
* **Data Points:**
* 1 core: ~86000 ms
* 3 cores: ~45000 ms
* 5 cores: ~32000 ms
* 7 cores: ~26000 ms
* 9 cores: ~22000 ms
* 11 cores: ~19000 ms
* 13 cores: ~17000 ms
* 15 cores: ~15000 ms
* 17 cores: ~14000 ms
* 19 cores: ~13000 ms
* 21 cores: ~12000 ms
* 23 cores: ~12000 ms
* 25 cores: ~11000 ms
* 27 cores: ~11000 ms
* 29 cores: ~11000 ms
* 31 cores: ~11000 ms
* 33 cores: ~12000 ms
* 35 cores: ~12000 ms
* 37 cores: ~12000 ms
* 39 cores: ~12000 ms
* 41 cores: ~12000 ms
* 43 cores: ~12000 ms
* 45 cores: ~12000 ms
* 47 cores: ~11000 ms
**Signed Multiplication (Gray Bars):**
* **Trend:** The execution time decreases rapidly from 1 core to approximately 11 cores, then gradually decreases until around 31 cores, after which it stabilizes. The signed multiplication times are consistently slightly higher than the unsigned multiplication times.
* **Data Points:**
* 1 core: ~92000 ms
* 3 cores: ~48000 ms
* 5 cores: ~34000 ms
* 7 cores: ~27000 ms
* 9 cores: ~23000 ms
* 11 cores: ~20000 ms
* 13 cores: ~18000 ms
* 15 cores: ~16000 ms
* 17 cores: ~15000 ms
* 19 cores: ~14000 ms
* 21 cores: ~13000 ms
* 23 cores: ~12000 ms
* 25 cores: ~12000 ms
* 27 cores: ~12000 ms
* 29 cores: ~12000 ms
* 31 cores: ~12000 ms
* 33 cores: ~13000 ms
* 35 cores: ~13000 ms
* 37 cores: ~13000 ms
* 39 cores: ~13000 ms
* 41 cores: ~13000 ms
* 43 cores: ~13000 ms
* 45 cores: ~13000 ms
* 47 cores: ~12000 ms
### Key Observations
* Both unsigned and signed multiplication times decrease significantly as the core count increases from 1 to approximately 11.
* After 11 cores, the decrease in execution time becomes more gradual.
* The execution time stabilizes around 31 cores, with minimal improvement beyond that point.
* Signed multiplication consistently takes slightly longer than unsigned multiplication for the same core count.
### Interpretation
The data suggests that increasing the number of cores significantly reduces the execution time for both unsigned and signed multiplication operations, up to a certain point. The diminishing returns observed after approximately 11 cores indicate that there is a limit to the benefits of adding more cores for this specific task. The slight difference in execution time between signed and unsigned multiplication likely reflects the additional overhead involved in handling signed numbers. The stabilization of execution time after 31 cores suggests that the task becomes limited by other factors, such as memory bandwidth or inter-process communication overhead, rather than the number of available cores.