\n
## Line Chart: Guided beam search: MATH-500
### Overview
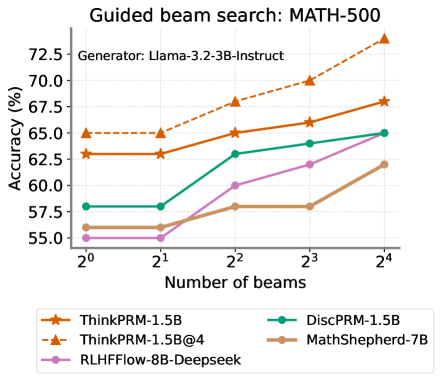
This is a line chart comparing the performance (accuracy) of five different AI models on the MATH-500 benchmark as the complexity of the "guided beam search" decoding method increases. The chart demonstrates how accuracy changes for each model when the number of beams used in the search is varied from 1 (2^0) to 16 (2^4).
### Components/Axes
* **Title:** "Guided beam search: MATH-500"
* **Subtitle/Generator:** "Generator: Llama-3.2-3B-Instruct"
* **Y-Axis:** Label is "Accuracy (%)". The scale runs from 55.0 to 72.5, with major tick marks at 2.5% intervals (55.0, 57.5, 60.0, 62.5, 65.0, 67.5, 70.0, 72.5).
* **X-Axis:** Label is "Number of beams". The scale is logarithmic base 2, with categorical tick marks at 2^0 (1), 2^1 (2), 2^2 (4), 2^3 (8), and 2^4 (16).
* **Legend:** Located at the bottom of the chart. It contains five entries, each with a unique color and marker symbol:
1. **ThinkPRM-1.5B:** Orange line with star markers (★).
2. **ThinkPRM-1.5B@4:** Orange dashed line with upward-pointing triangle markers (▲).
3. **RLHFFlow-8B-Deepseek:** Purple line with circle markers (●).
4. **DiscPRM-1.5B:** Green line with circle markers (●).
5. **MathShepherd-7B:** Brown line with circle markers (●).
### Detailed Analysis
The chart plots five data series. Below is an analysis of each, including approximate values extracted from the chart.
**1. ThinkPRM-1.5B@4 (Orange dashed line, ▲)**
* **Trend:** Shows a strong, consistent upward trend across all beam counts. It is the top-performing model at every data point except the first, where it ties with its non-@4 variant.
* **Data Points (Approximate):**
* 2^0 beams: ~65.0%
* 2^1 beams: ~65.0%
* 2^2 beams: ~68.0%
* 2^3 beams: ~70.0%
* 2^4 beams: ~73.5%
**2. ThinkPRM-1.5B (Orange solid line, ★)**
* **Trend:** Shows a steady upward trend. It starts at the same level as ThinkPRM-1.5B@4 but grows at a slightly slower rate, resulting in a performance gap that widens with more beams.
* **Data Points (Approximate):**
* 2^0 beams: ~63.0%
* 2^1 beams: ~63.0%
* 2^2 beams: ~65.0%
* 2^3 beams: ~66.0%
* 2^4 beams: ~68.0%
**3. DiscPRM-1.5B (Green line, ●)**
* **Trend:** Shows a moderate upward trend. It starts lower than the ThinkPRM models but closes the gap somewhat at higher beam counts.
* **Data Points (Approximate):**
* 2^0 beams: ~58.0%
* 2^1 beams: ~58.0%
* 2^2 beams: ~63.0%
* 2^3 beams: ~64.0%
* 2^4 beams: ~65.0%
**4. RLHFFlow-8B-Deepseek (Purple line, ●)**
* **Trend:** Shows a significant upward trend, especially after 2^1 beams. It starts as the lowest-performing model but experiences the largest relative gain, surpassing MathShepherd-7B.
* **Data Points (Approximate):**
* 2^0 beams: ~55.0%
* 2^1 beams: ~55.0%
* 2^2 beams: ~60.0%
* 2^3 beams: ~62.0%
* 2^4 beams: ~65.0%
**5. MathShepherd-7B (Brown line, ●)**
* **Trend:** Shows a modest upward trend with a notable plateau. It improves from 2^1 to 2^2 beams, then shows almost no improvement between 2^2 and 2^3 beams before rising again.
* **Data Points (Approximate):**
* 2^0 beams: ~56.0%
* 2^1 beams: ~56.0%
* 2^2 beams: ~58.0%
* 2^3 beams: ~58.0%
* 2^4 beams: ~62.0%
### Key Observations
1. **Universal Benefit from More Beams:** All five models show higher accuracy with 16 beams (2^4) than with 1 beam (2^0), indicating that guided beam search is generally effective for improving performance on this task.
2. **Performance Hierarchy:** A clear performance hierarchy is established and maintained as beam count increases. The ThinkPRM models (especially the @4 variant) consistently outperform the others.
3. **Diminishing Returns & Plateaus:** While all lines trend upward, the rate of improvement varies. MathShepherd-7B exhibits a clear plateau between 4 and 8 beams. The ThinkPRM-1.5B@4 line shows the steepest and most consistent slope.
4. **Convergence at High Beams:** At 16 beams, the performance of DiscPRM-1.5B and RLHFFlow-8B-Deepseek converges to approximately the same point (~65.0%).
5. **Initial Plateau:** For all models, there is little to no improvement in accuracy when increasing beams from 1 to 2 (2^0 to 2^1). The significant gains begin after this point.
### Interpretation
This chart provides a technical comparison of how different model architectures or training methods (represented by the five models) leverage increased computational effort during inference (more beams in guided search) to solve math problems.
* **What the data suggests:** The effectiveness of guided beam search is model-dependent. The "ThinkPRM" models, particularly the "@4" variant, are not only more accurate overall but also scale better with increased search complexity. This suggests their internal reasoning or reward modeling is better aligned with the guided search process.
* **Relationship between elements:** The X-axis (Number of beams) represents a controllable trade-off between computational cost and potential accuracy. The Y-axis (Accuracy) is the outcome. The different lines show the unique "scaling law" for each model type under this specific decoding strategy.
* **Notable patterns/anomalies:** The complete lack of improvement from 1 to 2 beams for all models is a striking pattern. It implies a threshold effect where a minimal increase in search breadth is insufficient to find better solutions; a more substantial increase (to 4 beams or more) is needed to unlock gains. The plateau for MathShepherd-7B suggests it may hit a performance ceiling with this method earlier than others. The strong performance of the ThinkPRM-1.5B@4 model indicates that its specific configuration (possibly an ensemble or a different decoding parameter denoted by "@4") is highly synergistic with guided beam search for this task.