# Technical Data Extraction: Coding Accuracy Comparison Across LLMs
This document contains a detailed extraction of data from a bar chart comparing the coding accuracy of three Large Language Models (LLMs) under different compression rates and datasets.
## 1. General Metadata
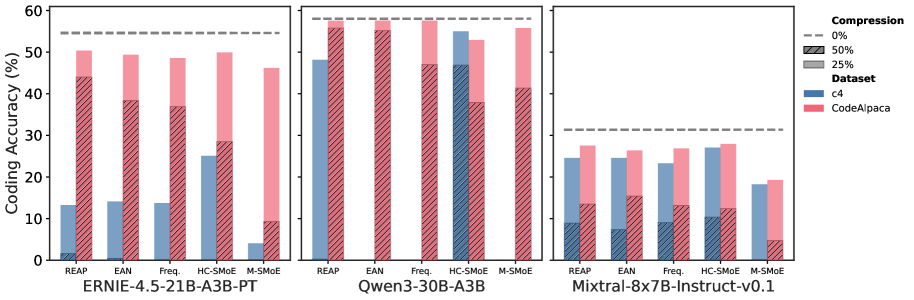
* **Y-Axis Title:** Coding Accuracy (%)
* **Y-Axis Scale:** 0 to 60 (increments of 10)
* **X-Axis Categories (Models):**
1. ERNIE-4.5-21B-A3B-PT
2. Qwen3-30B-A3B
3. Mixtral-8x7B-Instruct-v0.1
* **Sub-Categories (Methods) per Model:** REAP, EAN, Freq., HC-SMoE, M-SMoE.
## 2. Legend Information
### Compression Levels (Visualized by Bar Texture/Line)
* **0% Compression:** Represented by a horizontal dashed grey line across each model's plot.
* **25% Compression:** Represented by solid colored bars (top portion of the stacked/overlapping bars).
* **50% Compression:** Represented by hatched (diagonal lines) patterns on the bars.
### Datasets (Visualized by Color)
* **c4:** Blue bars.
* **CodeAlpaca:** Pink/Red bars.
---
## 3. Data Extraction by Model
### A. ERNIE-4.5-21B-A3B-PT
* **0% Compression Baseline:** ~55%
* **Data Points (Approximate %):**
| Method | Dataset | 25% Compression | 50% Compression (Hatched) |
| :--- | :--- | :--- | :--- |
| **REAP** | c4 | ~13% | ~2% |
| | CodeAlpaca | ~50% | ~44% |
| **EAN** | c4 | ~14% | ~1% |
| | CodeAlpaca | ~49% | ~38% |
| **Freq.** | c4 | ~14% | ~0% |
| | CodeAlpaca | ~48% | ~37% |
| **HC-SMoE** | c4 | ~25% | ~0% |
| | CodeAlpaca | ~50% | ~28% |
| **M-SMoE** | c4 | ~4% | ~0% |
| | CodeAlpaca | ~46% | ~9% |
### B. Qwen3-30B-A3B
* **0% Compression Baseline:** ~58%
* **Data Points (Approximate %):**
| Method | Dataset | 25% Compression | 50% Compression (Hatched) |
| :--- | :--- | :--- | :--- |
| **REAP** | c4 | ~48% | ~0% |
| | CodeAlpaca | ~57% | ~56% |
| **EAN** | c4 | ~0% | ~0% |
| | CodeAlpaca | ~57% | ~55% |
| **Freq.** | c4 | ~0% | ~0% |
| | CodeAlpaca | ~57% | ~47% |
| **HC-SMoE** | c4 | ~55% | ~47% |
| | CodeAlpaca | ~53% | ~38% |
| **M-SMoE** | c4 | ~0% | ~0% |
| | CodeAlpaca | ~56% | ~41% |
### C. Mixtral-8x7B-Instruct-v0.1
* **0% Compression Baseline:** ~31%
* **Data Points (Approximate %):**
| Method | Dataset | 25% Compression | 50% Compression (Hatched) |
| :--- | :--- | :--- | :--- |
| **REAP** | c4 | ~24% | ~9% |
| | CodeAlpaca | ~27% | ~13% |
| **EAN** | c4 | ~24% | ~7% |
| | CodeAlpaca | ~26% | ~15% |
| **Freq.** | c4 | ~23% | ~9% |
| | CodeAlpaca | ~27% | ~13% |
| **HC-SMoE** | c4 | ~27% | ~10% |
| | CodeAlpaca | ~28% | ~12% |
| **M-SMoE** | c4 | ~18% | ~0% |
| | CodeAlpaca | ~19% | ~5% |
---
## 4. Key Observations and Trends
* **Baseline Performance:** Qwen3-30B-A3B has the highest uncompressed coding accuracy (~58%), followed by ERNIE (~55%), with Mixtral being significantly lower (~31%).
* **Dataset Sensitivity:** Across almost all models and methods, performance on the **CodeAlpaca** dataset (pink) is significantly higher and more resilient to compression than on the **c4** dataset (blue).
* **Compression Impact:** Increasing compression from 25% to 50% (hatched areas) results in a sharp decline in accuracy. In several instances (especially for c4 on Qwen3 and ERNIE), 50% compression reduces accuracy to near 0%.
* **Method Performance:**
* **HC-SMoE** appears to be one of the more robust methods for maintaining accuracy under 25% compression across different models.
* **M-SMoE** generally shows the lowest resilience to compression, particularly at the 50% level.