## Chart/Diagram Type: Multi-Panel Figure
### Overview
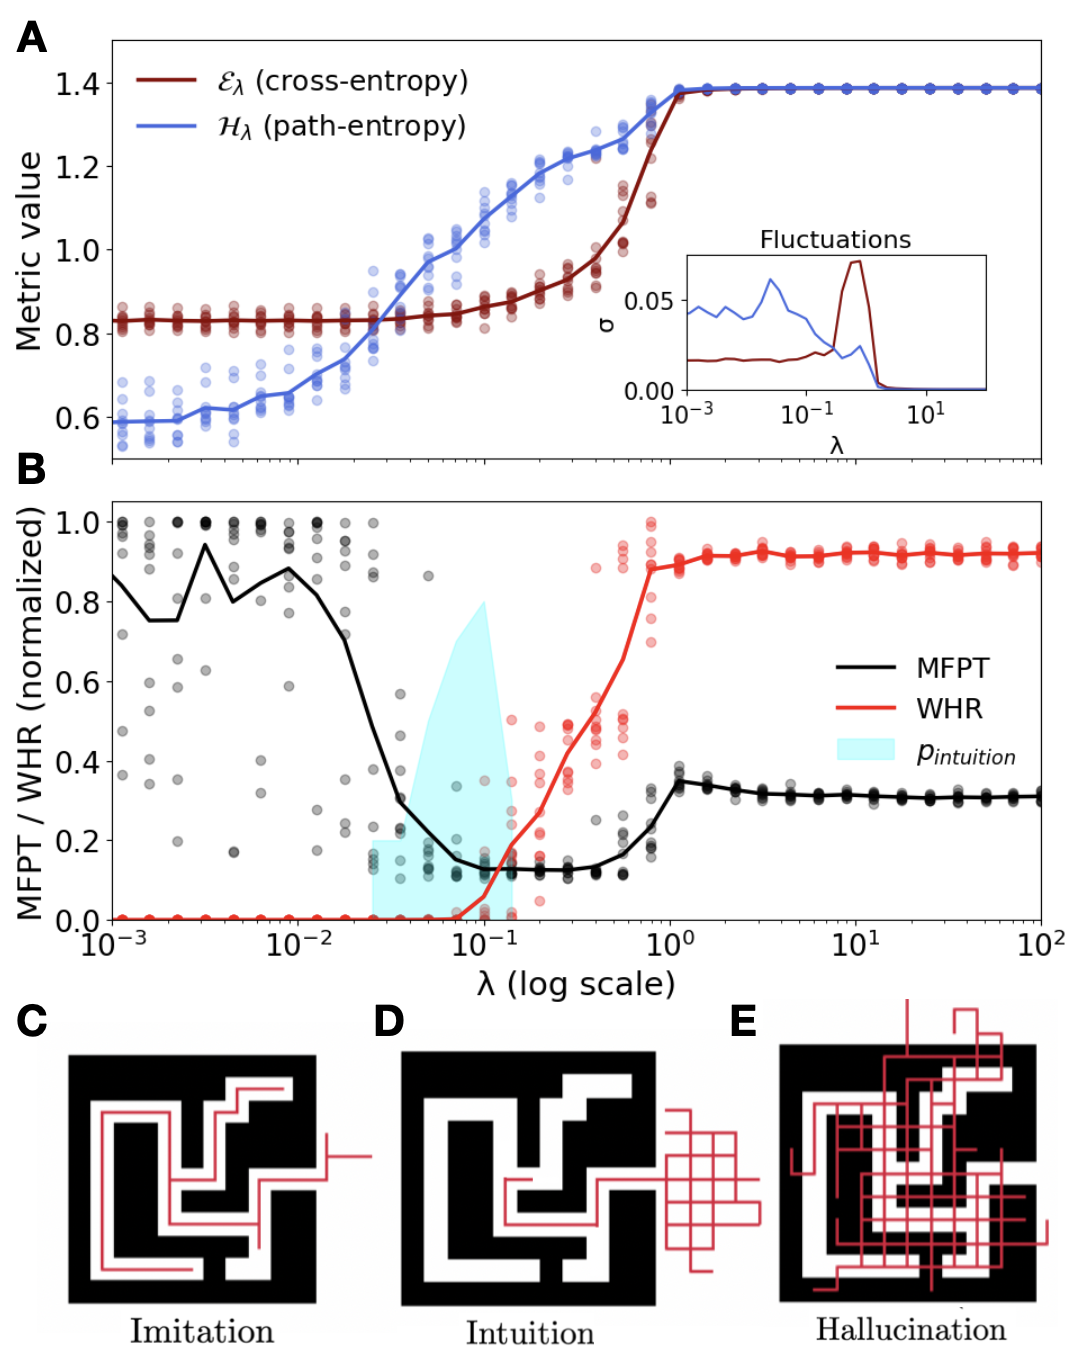
The image is a multi-panel figure (A-E) presenting data and diagrams related to cross-entropy, path-entropy, MFPT (Mean First Passage Time), WHR (?), and their relationship to a parameter lambda (λ). Panels A and B are plots showing the relationship between metric values/normalized MFPT/WHR and lambda. Panels C, D, and E are diagrams illustrating "Imitation", "Intuition", and "Hallucination" respectively.
### Components/Axes
**Panel A:**
* **Title:** Implicitly represents the relationship between cross-entropy, path-entropy, and lambda.
* **Y-axis:** "Metric value", ranging from 0.6 to 1.4.
* **X-axis:** Lambda (λ), implicitly on a log scale, ranging from approximately 10^-3 to 10^2.
* **Data Series:**
* ελ (cross-entropy): Represented by a dark red line with scattered red points.
* Hλ (path-entropy): Represented by a blue line with scattered blue points.
* **Inset Plot:** Located in the top-right corner, labeled "Fluctuations".
* Y-axis: σ, ranging from 0.00 to 0.05.
* X-axis: Lambda (λ), ranging from approximately 10^-3 to 10^1.
* Data Series: Dark red and blue lines, corresponding to cross-entropy and path-entropy fluctuations, respectively.
**Panel B:**
* **Title:** Implicitly represents the relationship between MFPT/WHR and lambda.
* **Y-axis:** "MFPT / WHR (normalized)", ranging from 0.0 to 1.0.
* **X-axis:** Lambda (λ (log scale)), ranging from approximately 10^-3 to 10^2.
* **Data Series:**
* MFPT: Represented by a black line with scattered gray points.
* WHR: Represented by a red line with scattered red points.
* p_intuition: Represented by a light blue shaded region.
**Panels C, D, E:**
* Diagrams illustrating paths within a maze-like structure.
* Paths are represented by red lines.
* Maze walls are represented by black regions.
* Titles: "Imitation" (C), "Intuition" (D), "Hallucination" (E).
### Detailed Analysis or ### Content Details
**Panel A:**
* **ελ (cross-entropy):**
* Trend: Relatively constant at approximately 0.8 from λ = 10^-3 to λ ≈ 0.1. Then, it increases sharply to approximately 1.4 at λ ≈ 1, and remains relatively constant thereafter.
* Values: Starts around 0.8, rises sharply around λ = 0.1, plateaus around 1.4.
* **Hλ (path-entropy):**
* Trend: Increases gradually from approximately 0.6 at λ = 10^-3 to approximately 1.4 at λ ≈ 1. Then, it remains relatively constant.
* Values: Starts around 0.6, rises gradually, plateaus around 1.4.
* **Fluctuations (Inset):**
* Cross-entropy (red): Low values until λ ≈ 1, then a sharp peak, then decreases.
* Path-entropy (blue): Higher values at low λ, decreases slightly, then increases slightly.
**Panel B:**
* **MFPT:**
* Trend: Starts high (around 0.8-1.0) at low λ, decreases to a minimum around λ = 0.1, then increases slightly and plateaus around 0.3-0.4.
* Values: Starts around 0.8-1.0, dips to around 0.1-0.2, plateaus around 0.3-0.4.
* **WHR:**
* Trend: Starts low (near 0) at low λ, increases sharply around λ = 0.1, and plateaus around 0.9-1.0.
* Values: Starts near 0, rises sharply around λ = 0.1, plateaus around 0.9-1.0.
* **p_intuition:**
* A shaded region indicating the range of λ where intuition is most prominent, centered around λ = 0.1.
**Panels C, D, E:**
* **Imitation:** The red path closely follows the structure of the maze, suggesting a direct, learned route.
* **Intuition:** The red path takes a more direct route, cutting corners and suggesting an understanding of the maze's overall structure. A grid of red lines extends from the exit, suggesting exploration.
* **Hallucination:** The red path is highly erratic, covering much of the maze and suggesting a lack of clear direction or understanding.
### Key Observations
* Cross-entropy and path-entropy converge at higher values of lambda.
* MFPT and WHR exhibit inverse trends with respect to lambda.
* The "intuition" region in Panel B corresponds to a transition point in the MFPT and WHR curves.
* The diagrams in Panels C, D, and E visually represent different strategies for navigating the maze, corresponding to different levels of understanding or information processing.
### Interpretation
The data suggests that as the parameter lambda increases, the system transitions from a state of "imitation" (low lambda) to a state of "hallucination" (high lambda), with an "intuitive" phase in between. The convergence of cross-entropy and path-entropy at higher lambda values may indicate a saturation point in the system's ability to distinguish between different paths. The inverse relationship between MFPT and WHR suggests a trade-off between the time it takes to find a solution (MFPT) and the likelihood of finding a solution (WHR). The "intuition" region represents a balance between these two factors, where the system can efficiently navigate the maze without relying solely on learned paths or random exploration. The diagrams visually reinforce these concepts, showing how the navigation strategy changes as the system transitions between these states.