## Diagram: Fuzzy Disjunction Network
### Overview
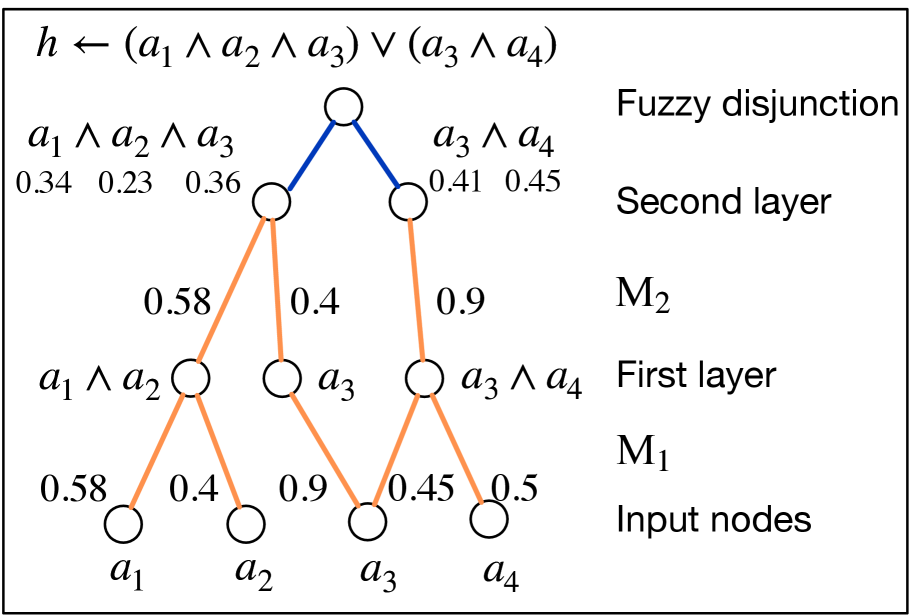
The image presents a diagram of a fuzzy disjunction network, illustrating the flow of information and the application of fuzzy logic operations. The network consists of four input nodes (a1, a2, a3, a4), two layers of intermediate nodes, and a final output node (h). The diagram shows the connections between nodes and the associated weights or values.
### Components/Axes
* **Nodes:** Represented by circles.
* Input Nodes: a1, a2, a3, a4 (bottom layer)
* First Layer Nodes: a1 ∧ a2, a3, a3 ∧ a4
* Second Layer Nodes: a1 ∧ a2 ∧ a3, a3 ∧ a4
* Output Node: h
* **Connections:** Represented by lines.
* Orange lines indicate connections between input nodes and first-layer nodes, and between first-layer nodes and second-layer nodes.
* Blue lines indicate connections between second-layer nodes and the output node.
* **Weights/Values:** Numerical values associated with the connections and nodes.
* **Labels:**
* h ← (a1 ∧ a2 ∧ a3) ∨ (a3 ∧ a4) (top)
* Fuzzy disjunction (right, top)
* Second layer (right, middle)
* M2 (right, middle)
* First layer (right, middle)
* M1 (right, bottom)
* Input nodes (right, bottom)
### Detailed Analysis
* **Input Nodes (Bottom Layer):**
* a1
* a2
* a3
* a4
* **First Layer:**
* Node: a1 ∧ a2. Connected to a1 with weight 0.58 and to a2 with weight 0.4.
* Node: a3. Connected to a2 with weight 0.9.
* Node: a3 ∧ a4. Connected to a3 with weight 0.45 and to a4 with weight 0.5.
* **Second Layer:**
* Node: a1 ∧ a2 ∧ a3. Receives input from a1 ∧ a2 with a value of 0.34, from a2 with a value of 0.23, and from a3 with a value of 0.36.
* Node: a3 ∧ a4. Receives input from a3 with a value of 0.41 and from a4 with a value of 0.45.
* **Output Node (Top):**
* h. Represents the fuzzy disjunction of (a1 ∧ a2 ∧ a3) and (a3 ∧ a4).
### Key Observations
* The diagram illustrates a hierarchical structure, with information flowing from the bottom (input nodes) to the top (output node).
* The connections between nodes have associated weights, indicating the strength or importance of each connection.
* The fuzzy logic operations (∧ and ∨) are used to combine the inputs at each layer.
### Interpretation
The diagram represents a fuzzy logic system designed to evaluate the expression h ← (a1 ∧ a2 ∧ a3) ∨ (a3 ∧ a4). The input nodes (a1, a2, a3, a4) represent fuzzy variables, and the connections between nodes represent fuzzy implications. The weights associated with the connections represent the degree of membership or truth value of each implication. The fuzzy AND (∧) and OR (∨) operations are used to combine the fuzzy variables at each layer, ultimately producing a fuzzy output value for h. The diagram provides a visual representation of the fuzzy inference process, allowing for a better understanding of the system's behavior.