## Stacked Area Chart: Growth of Job Numbers Across Software Ecosystems (2018-2023)
### Overview
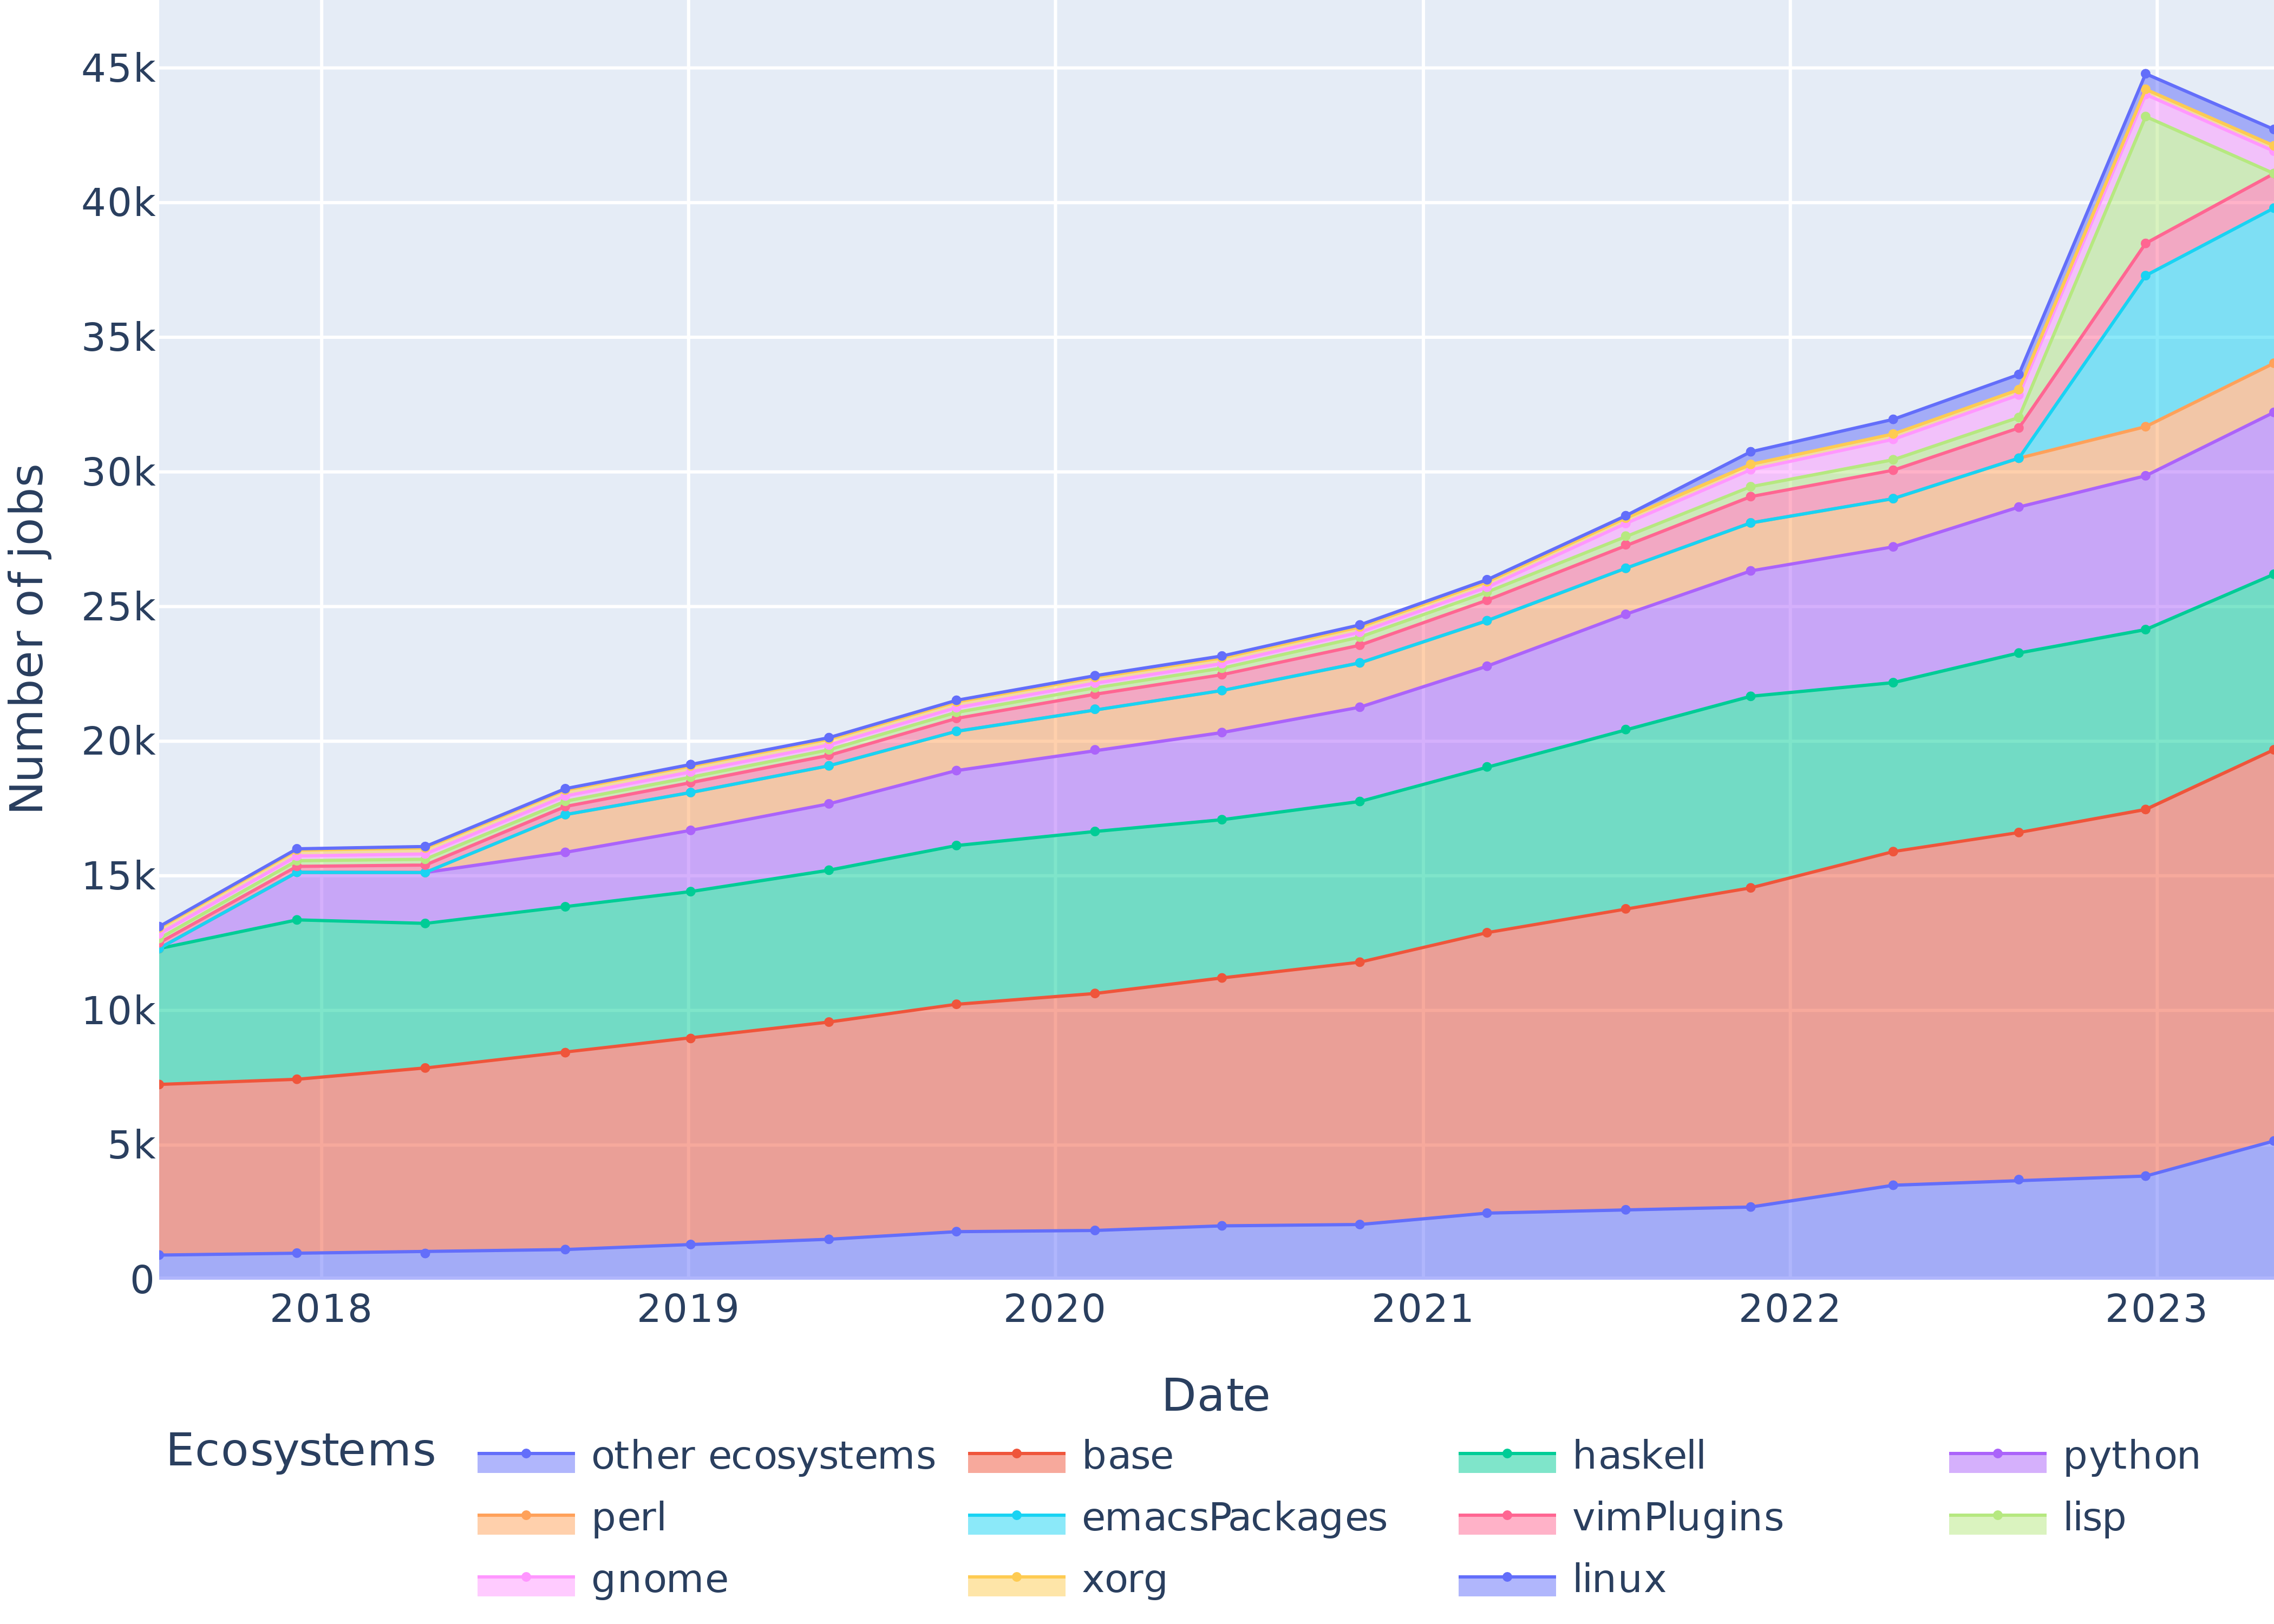
This is a stacked area chart illustrating the growth in the "Number of jobs" associated with various software ecosystems over a period from early 2018 to mid-2023. The chart shows a consistent upward trend in total jobs, with a particularly sharp increase occurring in 2023. Each colored band represents the contribution of a specific ecosystem to the total job count.
### Components/Axes
* **Chart Type:** Stacked Area Chart.
* **X-Axis (Horizontal):** Labeled "Date". Major tick marks denote the start of each year: 2018, 2019, 2020, 2021, 2022, 2023. Data points appear to be plotted quarterly or bi-annually.
* **Y-Axis (Vertical):** Labeled "Number of jobs". Scale ranges from 0 to 45,000 (45k), with major gridlines at 5k increments (0, 5k, 10k, 15k, 20k, 25k, 30k, 35k, 40k, 45k).
* **Legend:** Positioned at the bottom center of the chart, below the x-axis label. It lists 11 ecosystems with corresponding color swatches. The order in the legend (left to right, top to bottom) is:
1. `other ecosystems` (Light blue-purple)
2. `base` (Salmon/Red-orange)
3. `haskell` (Teal/Green)
4. `python` (Light purple)
5. `perl` (Light orange)
6. `emacsPackages` (Cyan/Light blue)
7. `vimPlugins` (Pink)
8. `lisp` (Light green)
9. `gnome` (Light pink)
10. `xorg` (Yellow)
11. `linux` (Darker blue-purple)
### Detailed Analysis
The chart is stacked, meaning the height of each colored band at a given time represents its individual contribution, and the top line represents the cumulative total. The stacking order from bottom to top is: `other ecosystems`, `base`, `haskell`, `python`, `perl`, `emacsPackages`, `vimPlugins`, `lisp`, `gnome`, `xorg`, `linux`.
**Trend Verification & Data Points (Approximate):**
* **Total Jobs (Top Line):** Shows a steady, near-linear increase from ~13k in early 2018 to ~34k by late 2022. In 2023, there is a dramatic spike, peaking at approximately 45k before a slight decline to ~43k by the chart's end.
* **Ecosystem Breakdown (Bottom to Top):**
* **`other ecosystems` (Light blue-purple):** Forms the base layer. Grows slowly and steadily from ~1k (2018) to ~5k (2023).
* **`base` (Salmon):** The largest single contributor throughout. Grows consistently from ~6.5k (2018, total ~7.5k) to ~15k (2022, total ~20k). In 2023, its contribution expands sharply to ~17k (total ~22k).
* **`haskell` (Teal):** The second-largest contributor. Grows from ~5k (2018, total ~12.5k) to ~7k (2022, total ~27k). In 2023, it expands to ~8k (total ~30k).
* **`python` (Light purple):** Shows significant growth. Starts at ~2k (2018, total ~14.5k), grows to ~4k (2022, total ~31k), and expands to ~5k in the 2023 spike (total ~35k).
* **`perl` (Light orange):** Moderate, steady growth. Contributes ~1k in 2018, ~2k in 2022, and ~2.5k during the 2023 peak.
* **`emacsPackages` (Cyan):** Similar growth pattern to perl. Contributes ~0.5k in 2018, ~1.5k in 2022, and ~2k in the 2023 spike.
* **`vimPlugins` (Pink):** Shows a very sharp increase in 2023. Was a thin band (~0.5k) for years, but during the 2023 spike, its contribution expands dramatically to ~4k.
* **`lisp` (Light green):** Also shows a dramatic 2023 expansion. Was minimal (~0.2k) pre-2023, but during the spike, it becomes a major contributor, adding ~4k.
* **`gnome` (Light pink), `xorg` (Yellow), `linux` (Darker blue-purple):** These form the top three thin bands. Their individual contributions remain relatively small and stable (each <1k) throughout the period, with slight increases visible during the 2023 total spike.
### Key Observations
1. **Dominant Ecosystems:** The `base` and `haskell` ecosystems are the foundational and largest contributors to job numbers throughout the entire period.
2. **Steady Growth Phase (2018-2022):** All ecosystems show gradual, consistent growth, leading to a total job count that more than doubled from ~13k to ~34k.
3. **2023 Anomaly/Surge:** There is a pronounced, simultaneous expansion in the contribution of nearly all ecosystems in 2023, causing the total to jump from ~34k to a peak of ~45k. This surge is most visually dramatic for `vimPlugins` and `lisp`, which transition from minor to major contributors in this short period.
4. **Stacking Clarity:** The chart effectively shows both the total growth and the changing composition of that total over time.
### Interpretation
This chart likely visualizes data from a package repository or job market platform tracking software development activity. The "Number of jobs" probably refers to build jobs, dependency resolution tasks, or job postings requiring specific ecosystem skills.
* **What the data suggests:** The consistent growth from 2018-2022 indicates a healthy, expanding overall ecosystem. The dramatic 2023 spike is the most significant feature. It could represent:
* A major platform or repository update that reclassified or massively increased the count of certain package types (especially `vimPlugins` and `lisp`).
* A viral trend or technological shift that caused a sudden, massive influx of activity or job demand in those specific areas.
* A change in data collection methodology.
* **Relationships:** The stacked nature shows that growth is broad-based; no single ecosystem is solely responsible for the overall trend. However, the `base` ecosystem acts as the stable core, while others like `python`, `vimPlugins`, and `lisp` show more variable, explosive growth potential.
* **Anomalies:** The 2023 spike is the primary anomaly. The near-simultaneous surge across disparate ecosystems (`vimPlugins`, `lisp`, `emacsPackages`) suggests a systemic cause rather than independent, coincidental growth. The slight decline after the peak in 2023 may indicate the initial surge stabilizing.