## Bar Chart: Condition: Time vs Core count
### Overview
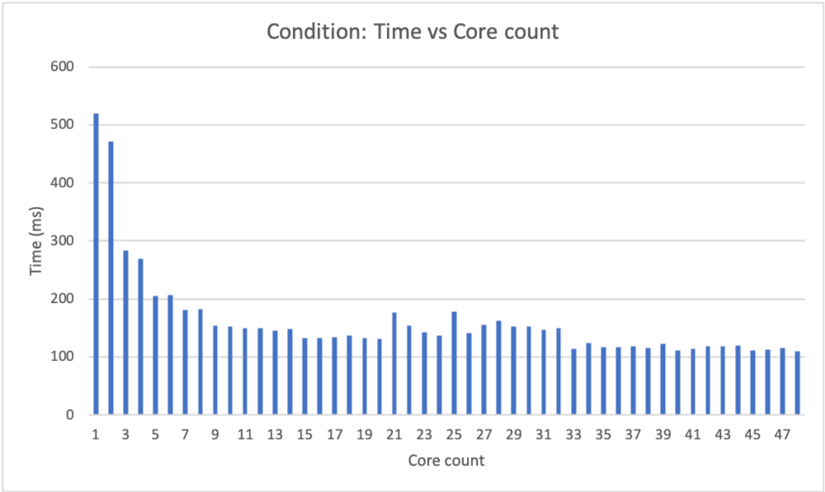
The image is a bar chart that displays the relationship between "Time (ms)" and "Core count". The chart shows how the time taken (in milliseconds) varies with the number of cores used. The bars are blue.
### Components/Axes
* **Title:** Condition: Time vs Core count
* **X-axis:** Core count, labeled from 1 to 47 in increments of 2.
* **Y-axis:** Time (ms), labeled from 0 to 600 in increments of 100.
### Detailed Analysis
The chart presents data for core counts from 1 to 47. The time values for each core count are represented by the height of the blue bars.
* **Core Count 1:** Time is approximately 520 ms.
* **Core Count 3:** Time is approximately 470 ms.
* **Core Count 5:** Time is approximately 280 ms.
* **Core Count 7:** Time is approximately 200 ms.
* **Core Count 9:** Time is approximately 180 ms.
* **Core Count 11:** Time is approximately 150 ms.
* **Core Count 13:** Time is approximately 130 ms.
* **Core Count 15:** Time is approximately 130 ms.
* **Core Count 17:** Time is approximately 130 ms.
* **Core Count 19:** Time is approximately 130 ms.
* **Core Count 21:** Time is approximately 140 ms.
* **Core Count 23:** Time is approximately 180 ms.
* **Core Count 25:** Time is approximately 140 ms.
* **Core Count 27:** Time is approximately 160 ms.
* **Core Count 29:** Time is approximately 150 ms.
* **Core Count 31:** Time is approximately 150 ms.
* **Core Count 33:** Time is approximately 120 ms.
* **Core Count 35:** Time is approximately 120 ms.
* **Core Count 37:** Time is approximately 120 ms.
* **Core Count 39:** Time is approximately 120 ms.
* **Core Count 41:** Time is approximately 120 ms.
* **Core Count 43:** Time is approximately 120 ms.
* **Core Count 45:** Time is approximately 120 ms.
* **Core Count 47:** Time is approximately 110 ms.
The trend shows a rapid decrease in time as the core count increases from 1 to approximately 11. After that, the time values fluctuate between approximately 110 ms and 180 ms, with no clear trend.
### Key Observations
* The time taken is significantly higher for lower core counts (1-5).
* The time decreases sharply as the core count increases initially.
* Beyond a core count of approximately 11, the time stabilizes and fluctuates within a narrow range.
### Interpretation
The data suggests that increasing the core count initially leads to a significant reduction in processing time. However, after a certain point (around 11 cores), adding more cores does not result in a substantial decrease in time. This could indicate that the task being measured has a limit to how much it can be parallelized, or that other factors become the bottleneck beyond a certain number of cores. The initial drop indicates that parallel processing is effective up to a point, but diminishing returns are observed as the core count increases further.