## Bar Chart: MetaQA Hit@1 Scores
### Overview
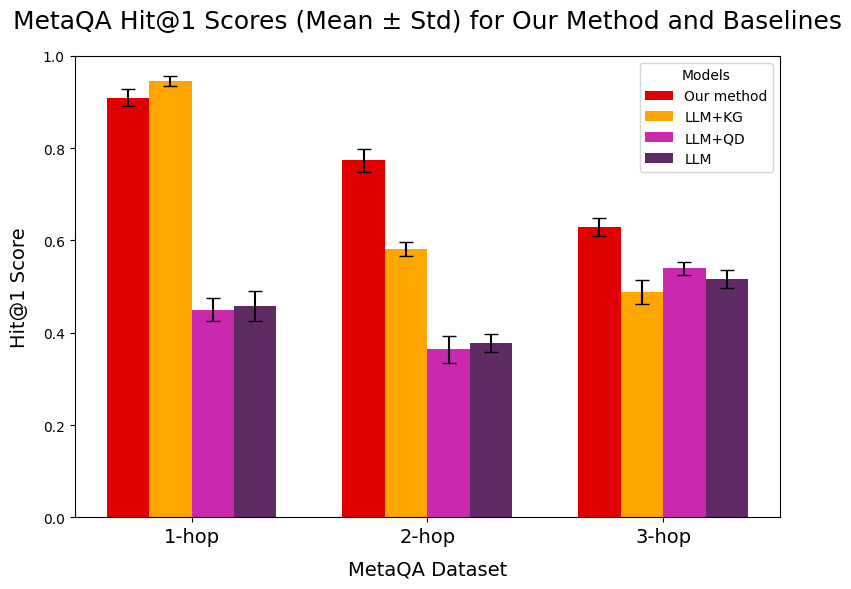
This bar chart presents the Hit@1 scores (Mean ± Std) for a new method and several baseline models on the MetaQA dataset, categorized by the number of hops (1-hop, 2-hop, and 3-hop). Error bars are included for each data point, representing the standard deviation.
### Components/Axes
* **Title:** "MetaQA Hit@1 Scores (Mean ± Std) for Our Method and Baselines" - positioned at the top-center.
* **X-axis:** "MetaQA Dataset" - with markers "1-hop", "2-hop", and "3-hop".
* **Y-axis:** "Hit@1 Score" - ranging from 0.0 to 1.0.
* **Legend:** Located in the top-right corner, listing the models:
* "Our method" (Red)
* "LLM+KG" (Orange)
* "LLM+QD" (Purple)
* "LLM" (Magenta)
### Detailed Analysis
The chart consists of three groups of bars, one for each hop value (1-hop, 2-hop, 3-hop). Each group contains four bars, representing the Hit@1 score for each of the four models. Error bars are present on top of each bar.
**1-hop:**
* **Our method (Red):** Approximately 0.93 ± 0.02. The bar extends to roughly 0.95 and down to 0.91.
* **LLM+KG (Orange):** Approximately 0.95 ± 0.02. The bar extends to roughly 0.97 and down to 0.93.
* **LLM+QD (Purple):** Approximately 0.46 ± 0.03. The bar extends to roughly 0.49 and down to 0.43.
* **LLM (Magenta):** Approximately 0.43 ± 0.03. The bar extends to roughly 0.46 and down to 0.40.
**2-hop:**
* **Our method (Red):** Approximately 0.78 ± 0.04. The bar extends to roughly 0.82 and down to 0.74.
* **LLM+KG (Orange):** Approximately 0.62 ± 0.04. The bar extends to roughly 0.66 and down to 0.58.
* **LLM+QD (Purple):** Approximately 0.39 ± 0.03. The bar extends to roughly 0.42 and down to 0.36.
* **LLM (Magenta):** Approximately 0.36 ± 0.03. The bar extends to roughly 0.39 and down to 0.33.
**3-hop:**
* **Our method (Red):** Approximately 0.65 ± 0.04. The bar extends to roughly 0.69 and down to 0.61.
* **LLM+KG (Orange):** Approximately 0.53 ± 0.04. The bar extends to roughly 0.57 and down to 0.49.
* **LLM+QD (Purple):** Approximately 0.51 ± 0.04. The bar extends to roughly 0.55 and down to 0.47.
* **LLM (Magenta):** Approximately 0.48 ± 0.04. The bar extends to roughly 0.52 and down to 0.44.
### Key Observations
* "Our method" consistently outperforms the baseline models (LLM+KG, LLM+QD, and LLM) across all hop values.
* LLM+KG generally performs better than LLM+QD and LLM.
* The performance of all models decreases as the number of hops increases.
* The error bars indicate that the standard deviation is relatively small, suggesting consistent results.
### Interpretation
The data suggests that the proposed method is effective in improving the Hit@1 score on the MetaQA dataset, particularly when compared to the baseline models. The decrease in performance with increasing hop values indicates that the task becomes more challenging as the reasoning chain lengthens. The relatively small standard deviations suggest that the results are reliable and not heavily influenced by random variations. The consistent outperformance of "Our method" suggests it is more robust to the increased complexity of multi-hop reasoning. The gap between "Our method" and the baselines widens as the hop count increases, indicating that the proposed method's advantage is more pronounced in more complex scenarios.