## Line Chart: GPU Throughput vs. Hidden Size
### Overview
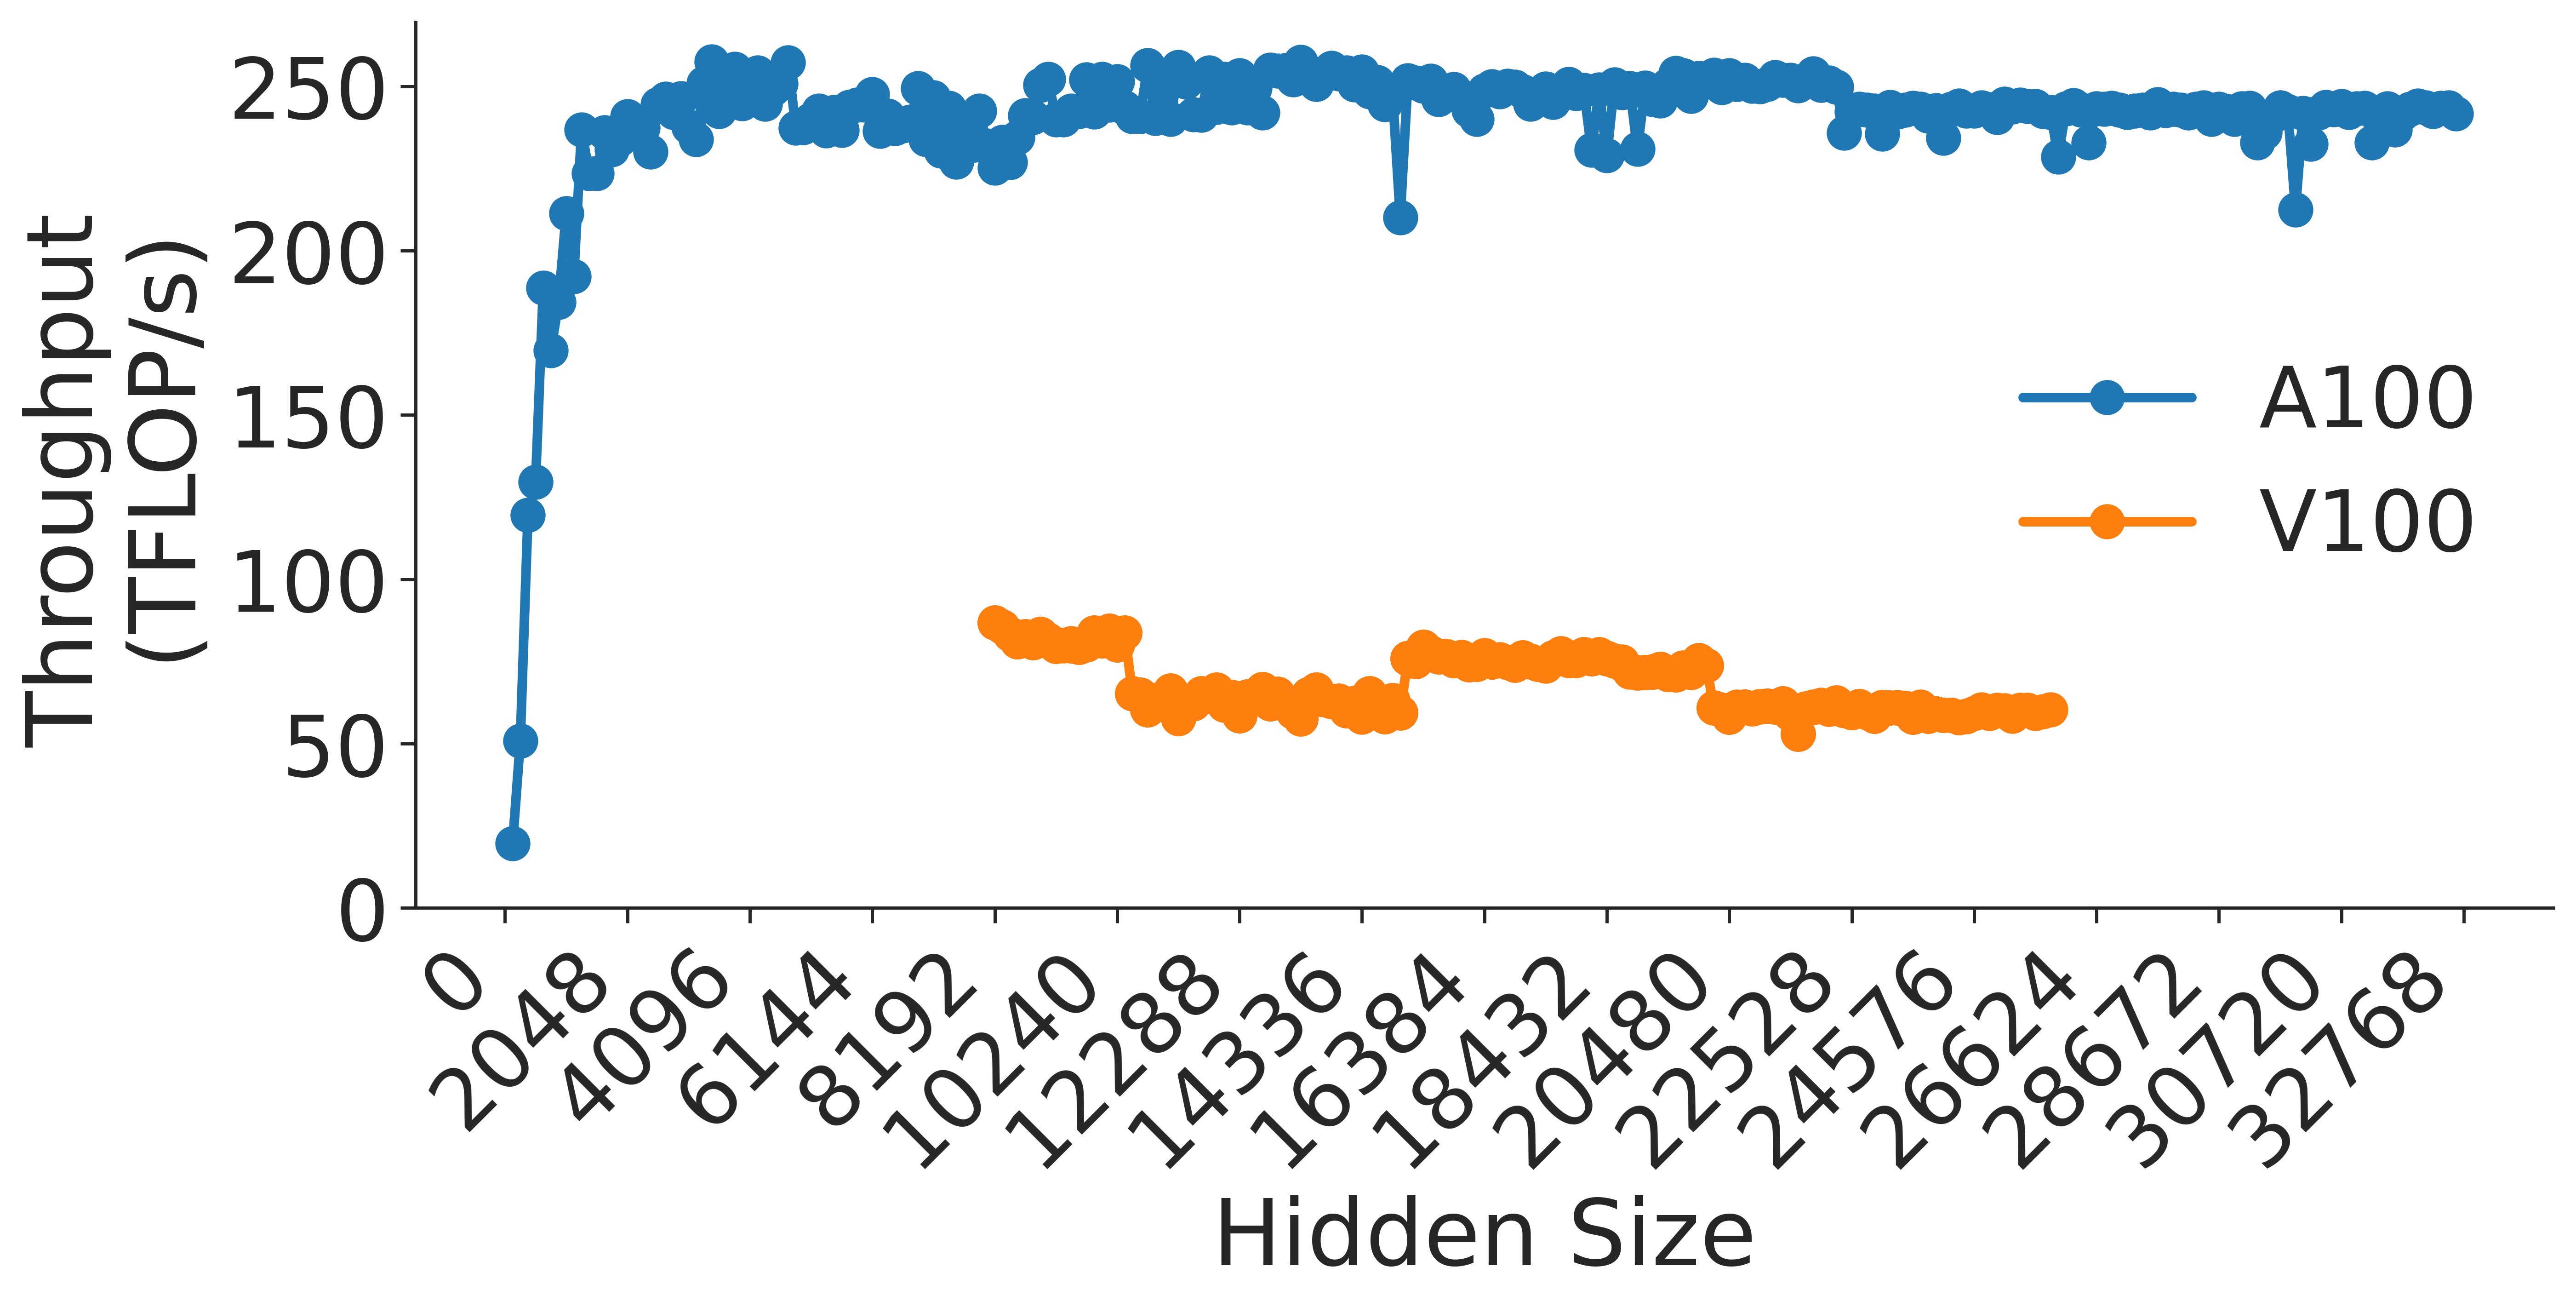
This image displays a line chart comparing the computational throughput (measured in TFLOP/s) of two NVIDIA GPU architectures, the A100 and the V100, across a range of "Hidden Size" parameters. The chart illustrates that the A100 provides significantly higher and more stable throughput compared to the V100, which exhibits performance volatility across different hidden sizes.
### Components/Axes
* **Y-Axis:** Labeled "Throughput (TFLOP/s)". The scale ranges from 0 to 250, with major tick marks every 50 units.
* **X-Axis:** Labeled "Hidden Size". The scale ranges from 0 to 32768. The axis uses increments of 2048. The labels are rotated 45 degrees for readability.
* **Legend:** Located on the right-center of the chart area.
* **Blue line with circle markers:** Labeled "A100"
* **Orange line with circle markers:** Labeled "V100"
### Detailed Analysis
#### A100 (Blue Series)
* **Trend:** The A100 series shows a very sharp, near-vertical increase in throughput from 0 to approximately 240 TFLOP/s between hidden sizes 0 and 2048. Following this initial ramp-up, the throughput plateaus, maintaining a high level of performance between 240 and 250 TFLOP/s for the remainder of the x-axis range.
* **Stability:** The performance is remarkably stable. There are minor, isolated dips (e.g., at hidden size 16384 and 28672) where throughput drops momentarily to approximately 210–220 TFLOP/s, but it consistently recovers to the ~240 TFLOP/s range.
#### V100 (Orange Series)
* **Trend:** The V100 data series begins at a hidden size of 10240. Unlike the A100, the V100 exhibits a distinct "staircase" or segmented pattern, indicating performance sensitivity to specific hidden size values.
* **Segmented Data Points:**
* **10240 to 12288:** Throughput is relatively high, hovering between 80 and 85 TFLOP/s.
* **12288 to 16384:** Throughput drops to a lower plateau of approximately 60–65 TFLOP/s.
* **16384 to 22528:** Throughput increases again to a plateau of approximately 75–80 TFLOP/s.
* **22528 to 28672:** Throughput drops back down to approximately 60 TFLOP/s.
### Key Observations
* **Performance Gap:** The A100 consistently outperforms the V100 by a factor of roughly 3x to 4x across the entire range where both are plotted.
* **Architectural Sensitivity:** The V100's performance is highly variable, suggesting that the workload is sensitive to memory alignment, tiling, or kernel optimization boundaries specific to the V100 architecture.
* **Saturation:** The A100 reaches its peak performance very early (at hidden size 2048), suggesting that for this specific operation, the GPU is compute-bound rather than memory-bound for the vast majority of the tested range.
### Interpretation
The data suggests that the A100 architecture is significantly more efficient and robust for this specific computational task than the V100. The "staircase" pattern observed in the V100 data is a classic indicator of GPU kernel performance cliffs, where specific input sizes (hidden sizes) align poorly with the GPU's memory architecture (e.g., shared memory bank conflicts or inefficient warp utilization). The A100's ability to maintain a flat, high-throughput line suggests that its hardware or the associated software kernels are better optimized to handle varying hidden sizes without incurring the performance penalties seen on the V100.