\n
## Line Chart: Regret and Cumulative Travel Time vs. Optimal
### Overview
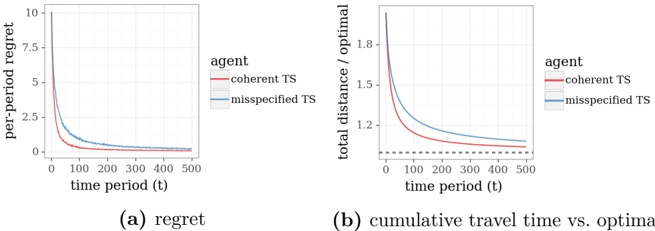
The image presents two line charts side-by-side. The left chart (a) displays "regret" on the y-axis against "time period (t)" on the x-axis. The right chart (b) shows "total distance / optimal" on the y-axis against "time period (t)" on the x-axis. Both charts compare two "agent" types: "coherent TS" and "misspecified TS".
### Components/Axes
* **Chart (a): Regret**
* X-axis: "time period (t)", ranging from 0 to 500.
* Y-axis: "per-period regret", ranging from 0 to 10.
* **Chart (b): Cumulative Travel Time vs. Optimal**
* X-axis: "time period (t)", ranging from 0 to 500.
* Y-axis: "total distance / optimal", ranging from 0 to 1.8.
* **Legend (Both Charts):**
* "coherent TS" - represented by a solid red line.
* "misspecified TS" - represented by a dashed grey line.
* The legend is positioned in the top-right corner of each chart.
### Detailed Analysis or Content Details
**Chart (a): Regret**
* **coherent TS (Red Line):** The line starts at approximately 9.5 at t=0, then rapidly decreases, becoming nearly flat around a value of 0.1 at t=200. It remains relatively stable between 0.1 and 0.2 for the rest of the time period.
* **misspecified TS (Grey Dashed Line):** The line begins at approximately 3.5 at t=0, and decreases more slowly than the red line. It reaches approximately 0.2 at t=200, and continues to decrease, leveling off around 0.15 at t=400.
**Chart (b): Cumulative Travel Time vs. Optimal**
* **coherent TS (Red Line):** The line starts at approximately 1.8 at t=0, and decreases rapidly, reaching approximately 1.1 at t=100. It continues to decrease, leveling off around 1.05 at t=400.
* **misspecified TS (Grey Dashed Line):** The line begins at approximately 1.1 at t=0, and decreases more slowly than the red line. It reaches approximately 1.05 at t=200, and continues to decrease, leveling off around 1.03 at t=400. A dotted horizontal line is present at y=1.0.
### Key Observations
* In both charts, the "coherent TS" agent consistently exhibits lower values than the "misspecified TS" agent, indicating better performance.
* The rate of decrease is faster for the "coherent TS" agent in both charts, especially in the initial time periods.
* The "misspecified TS" agent's performance plateaus at a higher level than the "coherent TS" agent.
* The dotted line in chart (b) at y=1.0 suggests a benchmark or optimal performance level.
### Interpretation
The data suggests that the "coherent TS" agent is more effective at minimizing regret and achieving a travel time closer to the optimal solution compared to the "misspecified TS" agent. The rapid initial decrease in both charts for the "coherent TS" agent indicates a faster learning or adaptation process. The leveling off of both lines suggests that the agents are approaching a stable state, but the "misspecified TS" agent remains at a suboptimal level. The dotted line in chart (b) provides a reference point, showing that while both agents improve over time, neither fully reaches the optimal travel time. The difference in performance between the two agents highlights the importance of accurate model specification ("coherent TS" vs. "misspecified TS") in achieving optimal results. The charts demonstrate a clear trade-off between regret and cumulative travel time, with the "coherent TS" agent consistently outperforming the "misspecified TS" agent in both metrics.