TECHNICAL ASSET FINGERPRINT
90f548395a7366d8d7f1612b
Click to view fullscreen
Press ESC or click to close
FOUND IN PAPERS
EXPERT: healer-alpha-free VERSION 1
RUNTIME: free/openrouter/healer-alpha
INTEL_VERIFIED
## [Chart Type]: Multi-Panel Line Chart - Reinforcement Learning Algorithm Performance Comparison
### Overview
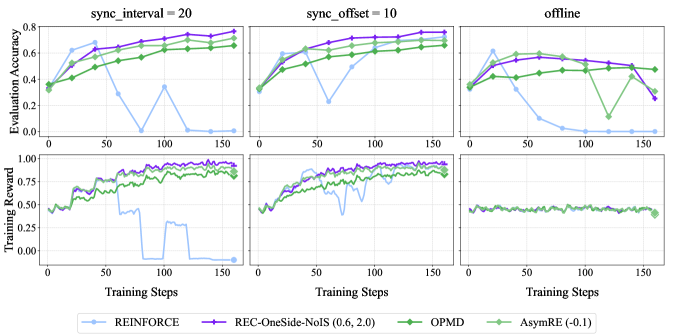
The image displays a 2x3 grid of line charts comparing the performance of four reinforcement learning algorithms across three different training conditions. The top row of charts measures "Evaluation Accuracy," while the bottom row measures "Training Reward." The x-axis for all charts is "Training Steps," ranging from 0 to 150. The three columns represent distinct experimental conditions: `sync_interval = 20`, `sync_offset = 10`, and `offline`. A shared legend is positioned at the bottom center of the entire figure.
### Components/Axes
* **Chart Titles (Top Row, Left to Right):** `sync_interval = 20`, `sync_offset = 10`, `offline`.
* **Y-Axis Labels:**
* Top Row: `Evaluation Accuracy` (Scale: 0.0 to 0.8, with increments of 0.2).
* Bottom Row: `Training Reward` (Scale: 0.00 to 1.00, with increments of 0.25).
* **X-Axis Label (Common to all charts):** `Training Steps` (Scale: 0 to 150, with major ticks at 0, 50, 100, 150).
* **Legend (Bottom Center):** Contains four entries, each with a colored line and marker symbol:
1. **REINFORCE:** Light blue line with circular markers.
2. **REC-OneSide-NoIS (0.6, 2.0):** Purple line with plus-sign markers.
3. **OPMD:** Green line with diamond markers.
4. **AsymRE (-0.1):** Light green line with square markers.
### Detailed Analysis
**Top Row: Evaluation Accuracy**
* **sync_interval = 20 (Top-Left Chart):**
* **REC-OneSide-NoIS (Purple):** Shows a strong, steady upward trend from ~0.35 at step 0 to a peak of ~0.8 at step 150. It is the top-performing algorithm for most of the training.
* **OPMD (Green):** Also shows a steady upward trend, starting near ~0.35 and reaching ~0.7 by step 150. It consistently performs below REC-OneSide-NoIS.
* **AsymRE (Light Green):** Follows a similar upward trajectory to OPMD, ending near ~0.65 at step 150.
* **REINFORCE (Light Blue):** Exhibits highly unstable performance. It starts near ~0.35, spikes to ~0.65 around step 25, then crashes to near 0.0 by step 75. It shows a brief recovery to ~0.35 at step 100 before dropping back to near 0.0.
* **sync_offset = 10 (Top-Center Chart):**
* **REC-OneSide-NoIS (Purple):** Again shows a strong upward trend, starting ~0.35 and reaching ~0.8 by step 150.
* **OPMD (Green):** Follows a similar upward path, ending near ~0.7.
* **AsymRE (Light Green):** Trends upward to ~0.65.
* **REINFORCE (Light Blue):** Shows instability. It starts ~0.35, peaks near ~0.6 at step 25, drops sharply to ~0.2 at step 75, recovers to ~0.6 at step 100, then declines to near 0.0 by step 150.
* **offline (Top-Right Chart):**
* **REC-OneSide-NoIS (Purple):** Performance is less stable here. It starts ~0.35, peaks near ~0.6 at step 50, then gradually declines to ~0.2 by step 150.
* **OPMD (Green):** Shows a moderate upward trend to ~0.5 at step 100, then a sharp drop to ~0.1 at step 125, followed by a recovery to ~0.5 at step 150.
* **AsymRE (Light Green):** Trends upward to ~0.5 by step 100, then declines to ~0.3 by step 150.
* **REINFORCE (Light Blue):** Starts ~0.35, peaks near ~0.6 at step 25, then crashes to near 0.0 by step 75 and remains there.
**Bottom Row: Training Reward**
* **sync_interval = 20 (Bottom-Left Chart):**
* **REC-OneSide-NoIS (Purple):** Shows a noisy but clear upward trend from ~0.4 to near 1.0 by step 150.
* **OPMD (Green):** Also trends upward with noise, reaching ~0.9 by step 150.
* **AsymRE (Light Green):** Follows a similar noisy upward path, ending near ~0.85.
* **REINFORCE (Light Blue):** Extremely unstable. It fluctuates between ~0.4 and ~0.7 until step 75, then crashes to near 0.0, with a brief, partial recovery around step 100 before falling back to 0.0.
* **sync_offset = 10 (Bottom-Center Chart):**
* **REC-OneSide-NoIS (Purple):** Strong upward trend with noise, approaching 1.0 by step 150.
* **OPMD (Green):** Upward trend, reaching ~0.9.
* **AsymRE (Light Green):** Upward trend, reaching ~0.85.
* **REINFORCE (Light Blue):** Shows significant volatility. It fluctuates between ~0.5 and ~0.8 until step 100, then drops sharply to near 0.0 by step 125.
* **offline (Bottom-Right Chart):**
* **All Algorithms:** Performance is markedly different and poor in this condition. All four lines (Purple, Green, Light Green, Light Blue) are tightly clustered and nearly flat, hovering around a Training Reward of ~0.4 to ~0.5 for the entire duration of 150 steps. There is minimal improvement or divergence between the algorithms.
### Key Observations
1. **Algorithm Stability:** REC-OneSide-NoIS (Purple) is the most consistent top performer in the `sync_interval` and `sync_offset` conditions for both metrics. REINFORCE (Light Blue) is consistently the most unstable, often suffering catastrophic performance collapses.
2. **Condition Impact:** The `offline` condition severely degrades performance and eliminates the differentiation between algorithms. All methods perform poorly and similarly.
3. **Metric Correlation:** In the first two conditions, trends in Evaluation Accuracy generally correlate with trends in Training Reward for each algorithm.
4. **OPMD Anomaly:** In the `offline` Evaluation Accuracy chart, OPMD (Green) shows a unique, sharp V-shaped dip and recovery between steps 100 and 150, which is not mirrored in its Training Reward for the same condition.
### Interpretation
This data suggests that the synchronization strategy (`sync_interval` vs. `sync_offset`) is critical for the effective training of these algorithms, with `sync_offset=10` yielding slightly more stable high-end performance for the leading algorithm (REC-OneSide-NoIS). The `offline` setting appears to be a fundamentally more difficult or poorly configured learning environment, as it prevents meaningful learning progress for all tested methods.
The REC-OneSide-NoIS algorithm demonstrates superior robustness and learning efficiency in the synchronized settings. In contrast, the classic REINFORCE algorithm shows a high susceptibility to training instability, which may be linked to issues like high variance in gradient estimates. The near-identical, flat performance in the `offline` condition indicates a potential failure mode or a scenario where the problem setup itself (e.g., lack of environment interaction or feedback) is the primary bottleneck, not the choice of algorithm. The outlier dip in OPMD's accuracy in the offline chart, without a corresponding dip in reward, might indicate a temporary misalignment between the agent's policy (which determines reward) and the evaluation metric, or simply noise in the evaluation process.
DECODING INTELLIGENCE...