## Spectrogram Comparison: Speech Synthesis Models
### Overview
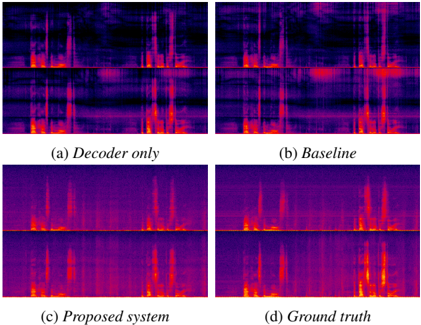
The image presents a visual comparison of spectrograms generated by different speech synthesis models, including a "Decoder only" model, a "Baseline" model, a "Proposed system," and the "Ground truth" spectrogram. Each model's output is displayed as a spectrogram, showing frequency content over time. The spectrograms are displayed in a 2x2 grid.
### Components/Axes
Each spectrogram displays frequency on the vertical axis and time on the horizontal axis, though specific scales are not provided. The color intensity represents the magnitude of the frequency components, with darker colors indicating lower magnitudes and brighter colors (towards red/yellow) indicating higher magnitudes.
The subplots are labeled as follows:
* **(a) Decoder only**: Spectrogram generated by a decoder-only model.
* **(b) Baseline**: Spectrogram generated by a baseline model.
* **(c) Proposed system**: Spectrogram generated by the proposed system.
* **(d) Ground truth**: Spectrogram representing the actual speech signal.
### Detailed Analysis
Each spectrogram is divided into two horizontal sections, presumably representing different aspects of the audio signal or different channels.
* **(a) Decoder only**: The spectrogram shows some distinct vertical bands, indicating the presence of specific frequencies over time. The intensity is generally lower compared to the other spectrograms.
* **(b) Baseline**: This spectrogram shows more intense frequency components compared to the "Decoder only" model, with some distinct vertical bands and some areas of higher intensity.
* **(c) Proposed system**: The spectrogram generated by the proposed system appears to have a higher resolution and more distinct frequency components compared to the "Decoder only" and "Baseline" models. It shows clear vertical bands and areas of high intensity.
* **(d) Ground truth**: The "Ground truth" spectrogram shows the actual speech signal, with distinct vertical bands and areas of high intensity. It serves as a reference for evaluating the performance of the other models.
### Key Observations
* The "Proposed system" spectrogram visually resembles the "Ground truth" spectrogram more closely than the "Decoder only" and "Baseline" spectrograms.
* The "Decoder only" spectrogram appears to have the lowest intensity and least defined frequency components.
* The "Baseline" spectrogram shows some improvement over the "Decoder only" spectrogram but is still less defined than the "Proposed system" and "Ground truth" spectrograms.
### Interpretation
The image suggests that the "Proposed system" is more effective at capturing the frequency characteristics of the speech signal compared to the "Decoder only" and "Baseline" models. The closer resemblance of the "Proposed system" spectrogram to the "Ground truth" spectrogram indicates that the proposed system is better at synthesizing speech that is similar to the actual speech signal. The spectrograms provide a visual representation of the performance of different speech synthesis models, allowing for a qualitative comparison of their outputs.