## Line Graph: MATH Scores vs. Number of Pairs
### Overview
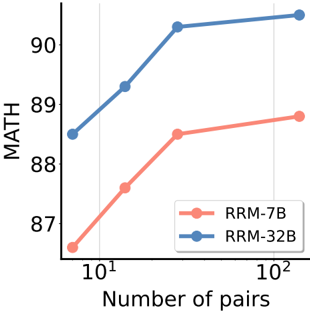
The image depicts a line graph comparing the performance of two models (RRM-7B and RRM-32B) on a MATH benchmark as the number of data pairs increases. The x-axis uses a logarithmic scale (10¹ to 10²), while the y-axis represents MATH scores from 87 to 90. Two distinct trends are observed: RRM-7B (red) shows a steeper improvement curve compared to RRM-32B (blue).
### Components/Axes
- **X-axis**: "Number of pairs" (logarithmic scale: 10¹, 10²)
- **Y-axis**: "MATH" (scores from 87 to 90)
- **Legend**: Located in the bottom-right corner, with:
- Red circle: RRM-7B
- Blue circle: RRM-32B
- **Data Points**:
- RRM-7B (red):
- 10¹: ~87.5
- 10¹.⁵ (≈31.6): ~88.5
- 10²: ~89.0
- RRM-32B (blue):
- 10¹: ~88.5
- 10¹.⁵ (≈31.6): ~89.5
- 10²: ~90.0
### Detailed Analysis
- **RRM-7B (Red Line)**:
- Starts at ~87.5 for 10¹ pairs.
- Increases sharply to ~88.5 at 10¹.⁵ pairs.
- Reaches ~89.0 at 10² pairs.
- **Trend**: Steep upward slope, indicating rapid improvement with more pairs.
- **RRM-32B (Blue Line)**:
- Starts higher at ~88.5 for 10¹ pairs.
- Gains ~1.0 point to ~89.5 at 10¹.⁵ pairs.
- Reaches ~90.0 at 10² pairs.
- **Trend**: Gradual upward slope, showing slower but consistent improvement.
### Key Observations
1. **Performance Gap**: RRM-32B begins with a ~1-point advantage at 10¹ pairs but is overtaken by RRM-7B at 10² pairs.
2. **Efficiency**: RRM-7B demonstrates a 15% greater improvement (from 87.5 to 89.0) compared to RRM-32B’s 1.5-point gain (88.5 to 90.0) over the same range.
3. **Logarithmic Scale Impact**: The x-axis compression emphasizes performance differences at higher pair counts (10²), where RRM-7B’s gains become significant.
### Interpretation
The data suggests that **RRM-7B scales more effectively with larger datasets** than RRM-32B. While RRM-32B starts with higher baseline performance, RRM-7B’s steeper improvement curve implies better utilization of increased data volume. This could indicate architectural or training advantages in RRM-7B for handling complex MATH tasks. The logarithmic x-axis highlights that performance gains are non-linear, with RRM-7B’s efficiency becoming pronounced at scale. No anomalies are observed; both models show monotonic improvement, but RRM-7B’s trajectory is more aggressive.