## Bar Chart: Impact of Filtering on Best-of-8 Mean Accuracy
### Overview
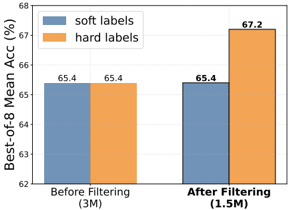
This image displays a grouped bar chart comparing the performance of two labeling strategies—"soft labels" and "hard labels"—across two distinct dataset conditions: "Before Filtering (3M)" and "After Filtering (1.5M)". The metric used for comparison is "Best-of-8 Mean Acc (%)".
### Components/Axes
* **Y-Axis:** Labeled "Best-of-8 Mean Acc (%)". The scale ranges from 62 to 68, with major grid lines at integer intervals.
* **X-Axis:** Categorized into two groups:
* "Before Filtering (3M)"
* "After Filtering (1.5M)"
* **Legend:** Positioned in the top-left corner of the chart area.
* Blue bar: "soft labels"
* Orange bar: "hard labels"
* **Data Markers:** Numerical values are printed directly above each bar to indicate the exact accuracy percentage.
### Detailed Analysis
The chart is divided into two primary clusters based on the filtering status of the dataset.
**1. Before Filtering (3M)**
* **Soft labels (Blue):** The bar reaches a height of **65.4**.
* **Hard labels (Orange):** The bar reaches a height of **65.4**.
* **Trend:** Both labeling methods yield identical performance results before the filtering process is applied.
**2. After Filtering (1.5M)**
* **Soft labels (Blue):** The bar remains at **65.4**.
* **Hard labels (Orange):** The bar rises to **67.2**.
* **Trend:** The "soft labels" performance remains stagnant compared to the "Before Filtering" state. Conversely, the "hard labels" performance shows a positive trend, increasing by 1.8 percentage points.
### Key Observations
* **Performance Invariance:** The "soft labels" methodology is completely unaffected by the filtering process, maintaining a consistent accuracy of 65.4% regardless of the dataset size (3M vs 1.5M).
* **Performance Gain:** The "hard labels" methodology benefits significantly from the filtering process, showing a clear improvement in accuracy after the dataset is reduced from 3M to 1.5M.
* **Comparative Shift:** Before filtering, there is no performance gap between the two methods. After filtering, "hard labels" outperform "soft labels" by 1.8 percentage points.
### Interpretation
The data suggests that the filtering process—which reduces the dataset size by half—is highly effective for the "hard labels" training regime but provides no additional value for the "soft labels" regime.
This implies that the "hard labels" approach is likely more sensitive to noise or lower-quality data within the original 3M dataset. By filtering the data, the "hard labels" model is likely trained on a higher-quality subset, allowing it to achieve higher accuracy. The fact that "soft labels" do not improve suggests that either the soft labels are inherently robust to the noise present in the 3M dataset, or that the filtering process removes data that the soft-label model requires to maintain its current performance level (though it does not degrade, suggesting the former is more likely).
From a resource-efficiency perspective, if one has the capability to filter the dataset, "hard labels" become the superior choice, as they yield higher accuracy on a smaller, more manageable dataset (1.5M) compared to the baseline.