## Bar Chart: Number of Snapshots vs. Number of Past Actions
### Overview
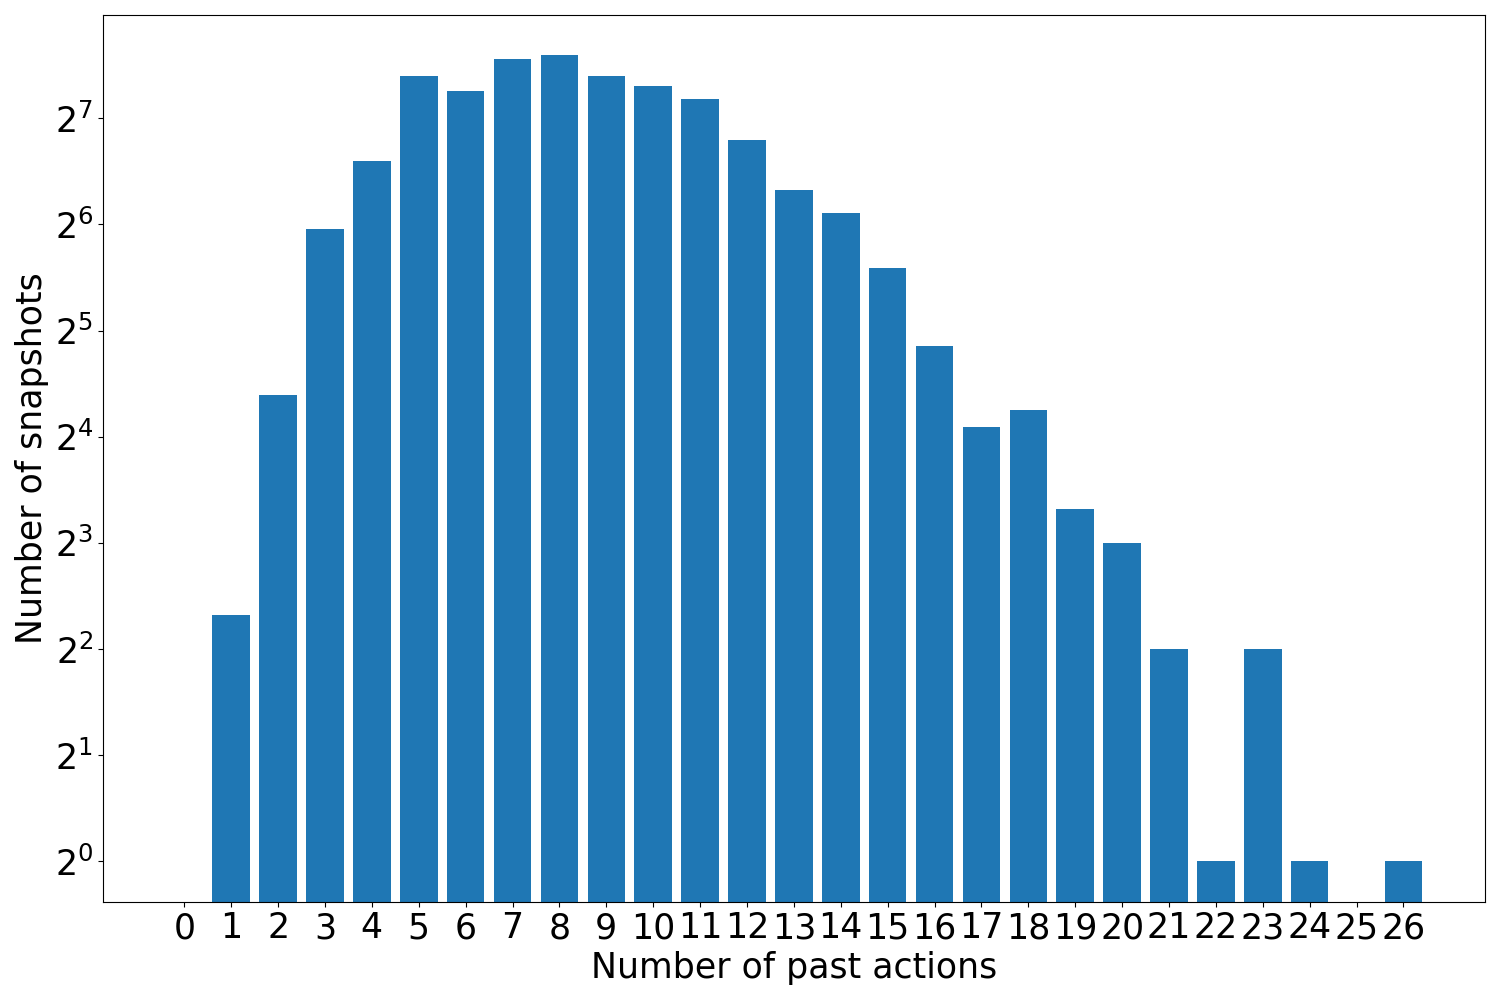
The image is a bar chart showing the distribution of snapshots based on the number of past actions. The x-axis represents the number of past actions, ranging from 0 to 26. The y-axis represents the number of snapshots, displayed on a logarithmic scale (base 2). The chart shows a distribution that initially increases, peaks around 7-9 past actions, and then decreases.
### Components/Axes
* **X-axis:** "Number of past actions" - Ranges from 0 to 26 in integer increments.
* **Y-axis:** "Number of snapshots" - Logarithmic scale (base 2) with markers at 2<sup>0</sup>, 2<sup>1</sup>, 2<sup>2</sup>, 2<sup>3</sup>, 2<sup>4</sup>, 2<sup>5</sup>, 2<sup>6</sup>, and 2<sup>7</sup>.
* **Bars:** Blue bars representing the number of snapshots for each number of past actions.
### Detailed Analysis
Here's a breakdown of the approximate values for the number of snapshots at different numbers of past actions. Note that these are approximate due to the logarithmic scale and visual estimation:
* **0 past actions:** Approximately 2<sup>2</sup> = 4 snapshots
* **1 past action:** Approximately 2<sup>2.2</sup> = 4.6 snapshots
* **2 past actions:** Approximately 2<sup>3.2</sup> = 9.2 snapshots
* **3 past actions:** Approximately 2<sup>4.3</sup> = 19.8 snapshots
* **4 past actions:** Approximately 2<sup>5.5</sup> = 45.3 snapshots
* **5 past actions:** Approximately 2<sup>6.5</sup> = 90.5 snapshots
* **6 past actions:** Approximately 2<sup>7</sup> = 128 snapshots
* **7 past actions:** Approximately 2<sup>7.2</sup> = 144 snapshots
* **8 past actions:** Approximately 2<sup>7.2</sup> = 144 snapshots
* **9 past actions:** Approximately 2<sup>7.1</sup> = 135 snapshots
* **10 past actions:** Approximately 2<sup>7</sup> = 128 snapshots
* **11 past actions:** Approximately 2<sup>6.8</sup> = 110 snapshots
* **12 past actions:** Approximately 2<sup>6.6</sup> = 95 snapshots
* **13 past actions:** Approximately 2<sup>6.3</sup> = 75 snapshots
* **14 past actions:** Approximately 2<sup>6</sup> = 64 snapshots
* **15 past actions:** Approximately 2<sup>5.6</sup> = 48 snapshots
* **16 past actions:** Approximately 2<sup>5.2</sup> = 36 snapshots
* **17 past actions:** Approximately 2<sup>4.8</sup> = 28 snapshots
* **18 past actions:** Approximately 2<sup>4.5</sup> = 22.6 snapshots
* **19 past actions:** Approximately 2<sup>3.8</sup> = 13.9 snapshots
* **20 past actions:** Approximately 2<sup>3.3</sup> = 9.8 snapshots
* **21 past actions:** Approximately 2<sup>2.8</sup> = 6.9 snapshots
* **22 past actions:** Approximately 2<sup>0.8</sup> = 1.7 snapshots
* **23 past actions:** Approximately 2<sup>2</sup> = 4 snapshots
* **24 past actions:** Approximately 2<sup>0.2</sup> = 1.1 snapshots
* **25 past actions:** Approximately 2<sup>0.2</sup> = 1.1 snapshots
* **26 past actions:** Approximately 2<sup>0</sup> = 1 snapshot
### Key Observations
* The distribution is unimodal, with a peak between 6 and 9 past actions.
* The number of snapshots increases rapidly from 0 to around 7 past actions.
* The number of snapshots decreases more gradually after the peak.
* There are relatively few snapshots with a very low or very high number of past actions.
### Interpretation
The chart suggests that the system being analyzed tends to operate with a moderate number of past actions. The peak in the distribution indicates that this range is the most common or stable state for the system. The rapid increase and gradual decrease could indicate that the system quickly reaches a stable state but takes longer to transition out of it. The low number of snapshots at the extremes suggests that these states are either rare or short-lived.