## Scatter Plot: Zcomplexity vs. C
### Overview
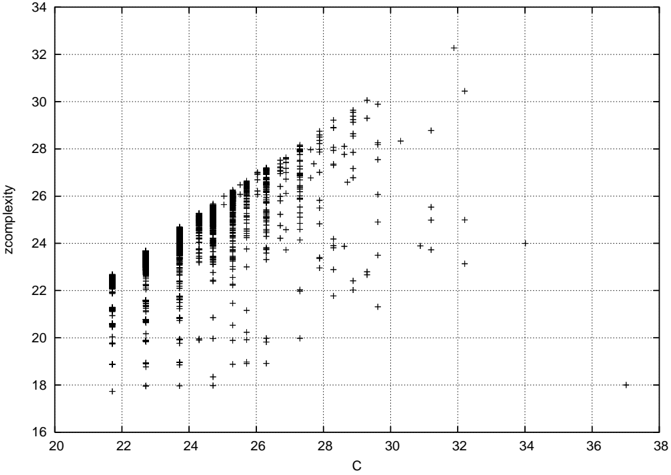
The image is a scatter plot showing the relationship between two variables, "C" on the x-axis and "zcomplexity" on the y-axis. The data points are represented by plus signs (+). The plot shows a general upward trend, indicating a positive correlation between C and zcomplexity. The data points are more densely clustered at lower values of C and zcomplexity, and become more scattered as both values increase.
### Components/Axes
* **X-axis:** Labeled "C", with a scale from 20 to 38 in increments of 2.
* **Y-axis:** Labeled "zcomplexity", with a scale from 16 to 34 in increments of 2.
* **Data Points:** Represented by "+" symbols.
* **Grid:** The plot has a grid of dotted lines to aid in reading values.
### Detailed Analysis
The data points show a general upward trend.
* **For C = 22:** zcomplexity ranges approximately from 19 to 24.
* **For C = 24:** zcomplexity ranges approximately from 20 to 26.
* **For C = 26:** zcomplexity ranges approximately from 22 to 28.
* **For C = 28:** zcomplexity ranges approximately from 23 to 30.
* **For C = 30:** zcomplexity ranges approximately from 24 to 32.
* **For C = 32:** zcomplexity ranges approximately from 25 to 33.
* **For C = 34:** zcomplexity ranges approximately from 26 to 33.
* **For C = 36:** zcomplexity ranges approximately from 27 to 33.
* **For C = 38:** zcomplexity ranges approximately from 28 to 33.
The density of points decreases as C increases.
### Key Observations
* There is a positive correlation between C and zcomplexity. As C increases, zcomplexity tends to increase as well.
* The spread of zcomplexity values for a given C increases as C increases. This suggests that the relationship between C and zcomplexity becomes less predictable at higher values of C.
* There are no obvious outliers, but the data points are more scattered at higher values of C.
### Interpretation
The scatter plot suggests that there is a relationship between the variables C and zcomplexity. The positive correlation indicates that as C increases, zcomplexity also tends to increase. However, the increasing spread of data points at higher values of C suggests that other factors may also be influencing zcomplexity. The data suggests that C is a contributing factor to zcomplexity, but not the sole determinant. Further investigation would be needed to determine the nature of the relationship and the influence of other factors.