\n
## Scatter Plot: Zcomplexity vs. C
### Overview
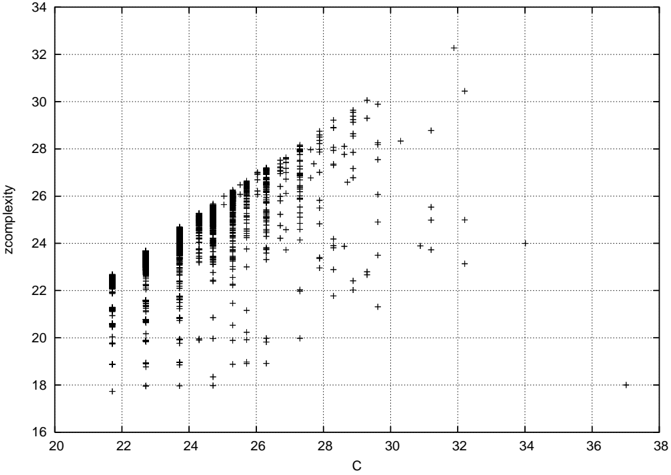
The image presents a scatter plot visualizing the relationship between two variables: 'zcomplexity' and 'C'. The plot consists of numerous data points represented by '+' symbols. The data appears to be clustered, with a general trend of increasing 'zcomplexity' as 'C' increases, but with significant variance.
### Components/Axes
* **X-axis:** Labeled "C", ranging from approximately 20 to 38. The axis has tick marks at integer values.
* **Y-axis:** Labeled "zcomplexity", ranging from approximately 16 to 34. The axis has tick marks at integer values.
* **Data Points:** Represented by '+' symbols scattered across the plot.
* **Grid:** A grid of vertical and horizontal lines provides a visual reference for reading values.
### Detailed Analysis
The data points exhibit the following characteristics:
* **Initial Cluster (C ≈ 20-22):** A dense cluster of points exists around C values between 20 and 22. The 'zcomplexity' values within this cluster range from approximately 18 to 23.
* **Increasing Trend (C ≈ 22-26):** As 'C' increases from 22 to 26, the data points generally trend upwards, indicating a positive correlation between 'C' and 'zcomplexity'. The density of points increases in this region.
* **Plateau/Saturation (C ≈ 26-28):** Between C values of 26 and 28, the data points reach a plateau, with 'zcomplexity' values clustering around 26-28. There is a high concentration of points in this area.
* **Scattering (C > 28):** For 'C' values greater than 28, the data points become more scattered. 'zcomplexity' values range from approximately 24 to 32, with no clear trend. There are several outliers with 'zcomplexity' values exceeding 30.
Approximate data points (sampled for representation):
* C = 20, zcomplexity ≈ 20
* C = 22, zcomplexity ≈ 22
* C = 24, zcomplexity ≈ 24
* C = 26, zcomplexity ≈ 27
* C = 28, zcomplexity ≈ 28
* C = 30, zcomplexity ≈ 26
* C = 32, zcomplexity ≈ 31
* C = 34, zcomplexity ≈ 25
* C = 36, zcomplexity ≈ 32
### Key Observations
* The relationship between 'C' and 'zcomplexity' is not strictly linear. It appears to be positive up to a certain point (around C = 28), after which the relationship becomes more erratic.
* There is significant variance in 'zcomplexity' for a given 'C' value, especially for 'C' values greater than 28.
* The data suggests a potential threshold effect, where increasing 'C' beyond a certain value does not necessarily lead to a corresponding increase in 'zcomplexity'.
### Interpretation
The scatter plot likely represents the relationship between a control parameter 'C' and a measure of system complexity 'zcomplexity'. The initial increase in 'zcomplexity' with 'C' suggests that increasing 'C' initially leads to greater complexity. However, the plateau and subsequent scattering of data points indicate that beyond a certain point, further increases in 'C' do not consistently increase complexity and may even lead to instability or reduced predictability.
The clustering and variance in the data could be due to several factors, such as:
* **Non-linear dynamics:** The underlying system may exhibit non-linear behavior, leading to complex interactions and unpredictable outcomes.
* **Multiple stable states:** The system may have multiple stable states, resulting in different 'zcomplexity' values for the same 'C' value.
* **Noise or measurement error:** The data may be affected by noise or measurement error, contributing to the variance.
Further investigation would be needed to determine the specific mechanisms driving the observed relationship between 'C' and 'zcomplexity'. The data suggests that optimizing 'C' for maximum 'zcomplexity' requires careful consideration of the potential for diminishing returns and instability.