## Bar Chart: Prediction Flip Rate Comparison for Mistral-7B Models
### Overview
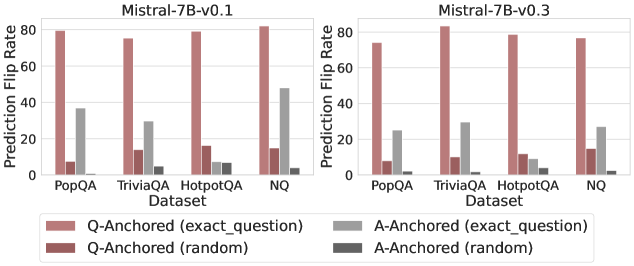
The image presents two bar charts comparing the prediction flip rates of two versions of the Mistral-7B model (v0.1 and v0.3) across four different question answering datasets: PopQA, TriviaQA, HotpotQA, and NQ. The charts illustrate the impact of anchoring the question or answer, using either the exact question/answer or a random variation.
### Components/Axes
* **Titles:**
* Left Chart: "Mistral-7B-v0.1"
* Right Chart: "Mistral-7B-v0.3"
* **Y-axis:** "Prediction Flip Rate" with a numerical scale from 0 to 80 in increments of 20.
* **X-axis:** "Dataset" with four categories: PopQA, TriviaQA, HotpotQA, NQ.
* **Legend:** Located at the bottom of the image.
* Light Red: "Q-Anchored (exact\_question)"
* Dark Red: "Q-Anchored (random)"
* Light Gray: "A-Anchored (exact\_question)"
* Dark Gray: "A-Anchored (random)"
### Detailed Analysis
**Left Chart (Mistral-7B-v0.1):**
* **PopQA:**
* Q-Anchored (exact\_question): Approximately 80
* Q-Anchored (random): Approximately 8
* A-Anchored (exact\_question): Approximately 37
* A-Anchored (random): Approximately 8
* **TriviaQA:**
* Q-Anchored (exact\_question): Approximately 76
* Q-Anchored (random): Approximately 14
* A-Anchored (exact\_question): Approximately 30
* A-Anchored (random): Approximately 5
* **HotpotQA:**
* Q-Anchored (exact\_question): Approximately 80
* Q-Anchored (random): Approximately 14
* A-Anchored (exact\_question): Approximately 8
* A-Anchored (random): Approximately 7
* **NQ:**
* Q-Anchored (exact\_question): Approximately 80
* Q-Anchored (random): Approximately 16
* A-Anchored (exact\_question): Approximately 57
* A-Anchored (random): Approximately 8
**Right Chart (Mistral-7B-v0.3):**
* **PopQA:**
* Q-Anchored (exact\_question): Approximately 74
* Q-Anchored (random): Approximately 8
* A-Anchored (exact\_question): Approximately 24
* A-Anchored (random): Approximately 2
* **TriviaQA:**
* Q-Anchored (exact\_question): Approximately 82
* Q-Anchored (random): Approximately 10
* A-Anchored (exact\_question): Approximately 26
* A-Anchored (random): Approximately 2
* **HotpotQA:**
* Q-Anchored (exact\_question): Approximately 78
* Q-Anchored (random): Approximately 10
* A-Anchored (exact\_question): Approximately 10
* A-Anchored (random): Approximately 4
* **NQ:**
* Q-Anchored (exact\_question): Approximately 78
* Q-Anchored (random): Approximately 12
* A-Anchored (exact\_question): Approximately 26
* A-Anchored (random): Approximately 1
### Key Observations
* For both model versions, the "Q-Anchored (exact\_question)" consistently shows the highest prediction flip rate across all datasets.
* The "Q-Anchored (random)" generally has a low prediction flip rate.
* The "A-Anchored (random)" consistently has the lowest prediction flip rate.
* The prediction flip rates for "Q-Anchored (exact\_question)" are generally high, hovering around 70-80 for both model versions.
* The "A-Anchored (exact\_question)" flip rate is higher for v0.1 than v0.3.
### Interpretation
The data suggests that using the exact question as an anchor leads to a significantly higher prediction flip rate compared to using a random variation of the question or answer. This indicates that the model is highly sensitive to the specific wording of the question. The lower flip rates when using random variations suggest that the model is more robust to slight changes in the input.
Comparing the two model versions, Mistral-7B-v0.3 generally exhibits lower prediction flip rates for "A-Anchored (exact\_question)" compared to v0.1, suggesting that v0.3 might be slightly more stable or less prone to flipping predictions when the answer is anchored. The "Q-Anchored (exact\_question)" remains high for both versions.
The high flip rate for "Q-Anchored (exact\_question)" could indicate a potential vulnerability or sensitivity in the model's architecture, where small changes in the question can lead to different predictions. This could be an area for further investigation and potential improvement in future model versions.