## Bar Chart with Stacked Area Charts: Performance Comparison of Different Approaches
### Overview
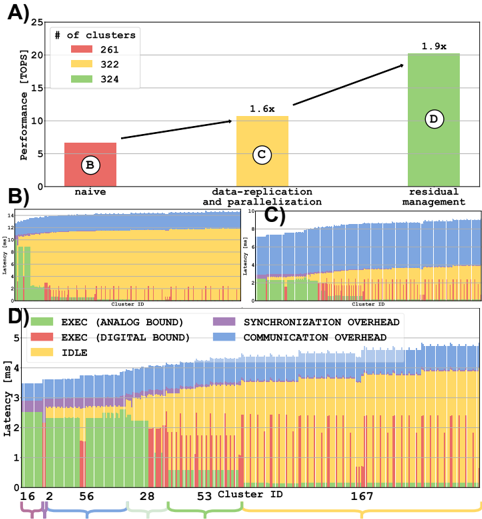
The image presents a performance comparison of three different approaches: "naive", "data-replication and parallelization", and "residual management". The performance is measured in TOPS (Tera Operations Per Second). The top portion (A) is a bar chart showing the performance of each approach. The bottom portion (B, C, D) consists of stacked area charts that break down the latency for each approach across different cluster IDs.
### Components/Axes
* **Top Chart (A):**
* X-axis: Approaches - "naive", "data-replication and parallelization", "residual management".
* Y-axis: Performance [TOPS], ranging from 0 to 25.
* Legend:
* Red: # of clusters = 261
* Yellow: # of clusters = 322
* Green: # of clusters = 324
* **Bottom Charts (B, C, D):**
* X-axis: Cluster ID, ranging from 0 to approximately 167.
* Y-axis: Latency [ms], ranging from 0 to 5.
* Legend:
* Green: EXEC (ANALOG BOUND)
* Yellow: EXEC (DIGITAL BOUND)
* Red: IDLE
* Blue: SYNCHRONIZATION OVERHEAD
* Gray: COMMUNICATION OVERHEAD
### Detailed Analysis or Content Details
**Top Chart (A):**
* **Naive:** Performance is approximately 5.2 TOPS (red bar).
* **Data-replication and parallelization:** Performance is approximately 8.3 TOPS (yellow bar). This is a 1.6x improvement over the naive approach, as indicated by the arrow and label.
* **Residual management:** Performance is approximately 21.5 TOPS (green bar). This is a 1.9x improvement over the naive approach, as indicated by the arrow and label.
**Bottom Charts (B, C, D):**
* **Chart B (Naive):** The latency is dominated by the yellow "EXEC (DIGITAL BOUND)" component, with some red "IDLE" and small amounts of green "EXEC (ANALOG BOUND)", blue "SYNCHRONIZATION OVERHEAD", and gray "COMMUNICATION OVERHEAD". The yellow component fluctuates between approximately 1ms and 4ms.
* **Chart C (Data-replication and parallelization):** The latency is dominated by the blue "SYNCHRONIZATION OVERHEAD" component, with significant yellow "EXEC (DIGITAL BOUND)" and smaller amounts of green "EXEC (ANALOG BOUND)", red "IDLE", and gray "COMMUNICATION OVERHEAD". The blue component fluctuates between approximately 1ms and 4ms.
* **Chart D (Residual management):** The latency is dominated by the green "EXEC (ANALOG BOUND)" component, with significant yellow "EXEC (DIGITAL BOUND)" and smaller amounts of red "IDLE", blue "SYNCHRONIZATION OVERHEAD", and gray "COMMUNICATION OVERHEAD". The green component fluctuates between approximately 1ms and 4ms.
### Key Observations
* The "residual management" approach significantly outperforms the other two approaches in terms of TOPS.
* The latency breakdown reveals that the "naive" approach is dominated by digital execution, the "data-replication and parallelization" approach is dominated by synchronization overhead, and the "residual management" approach is dominated by analog execution.
* The stacked area charts show considerable variation in latency across different cluster IDs for all three approaches.
### Interpretation
The data suggests that the "residual management" approach is the most effective for achieving high performance. This is likely due to its ability to leverage analog computation, as indicated by the dominance of the green "EXEC (ANALOG BOUND)" component in its latency breakdown. The "data-replication and parallelization" approach introduces significant synchronization overhead, which limits its performance. The "naive" approach is limited by digital execution.
The variation in latency across different cluster IDs suggests that the performance of each approach is sensitive to the specific characteristics of the clusters. This could be due to factors such as network connectivity, processing power, or data distribution.
The 1.6x and 1.9x improvements are relative to the "naive" approach, indicating the magnitude of the performance gains achieved by the other two approaches. The stacked area charts provide a more detailed understanding of the underlying factors that contribute to these performance differences. The image demonstrates a clear trade-off between execution type (analog vs. digital) and overhead (synchronization vs. communication).