\n
## Chart: MA vs. c
### Overview
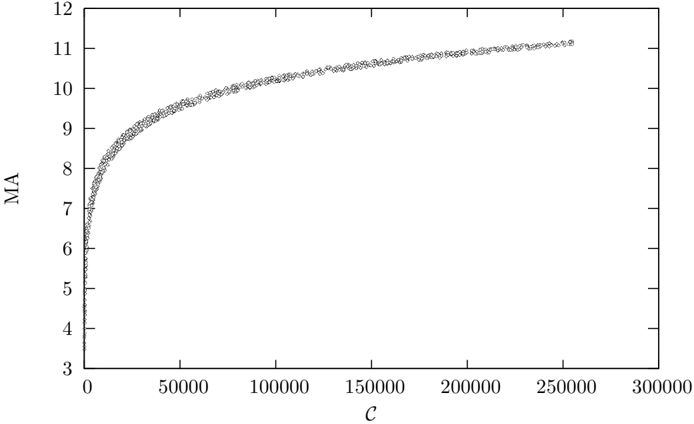
The image presents a scatter plot illustrating the relationship between two variables, labeled 'MA' on the y-axis and 'c' on the x-axis. The plot shows a non-linear relationship, with a steep increase in 'MA' for small values of 'c', followed by a leveling off as 'c' increases. The data appears to be densely clustered, forming a curve.
### Components/Axes
* **X-axis:** Labeled 'c'. The scale ranges from approximately 0 to 300,000.
* **Y-axis:** Labeled 'MA'. The scale ranges from approximately 3 to 12.
* **Data Series:** A single scatter plot of data points.
* **No Legend:** There is no legend present in the image.
### Detailed Analysis
The data points exhibit the following trend:
* **Initial Increase:** For 'c' values between 0 and approximately 50,000, 'MA' increases rapidly from around 3 to approximately 10. This is a steep, almost vertical, climb.
* **Leveling Off:** Between 'c' values of 50,000 and 250,000, the rate of increase in 'MA' significantly decreases. The curve flattens out, approaching a horizontal asymptote.
* **Asymptotic Behavior:** As 'c' approaches 300,000, 'MA' appears to converge towards a value of approximately 11.2.
Here are some approximate data points extracted from the plot:
* c = 0, MA ≈ 3.2
* c = 10,000, MA ≈ 7.5
* c = 20,000, MA ≈ 8.8
* c = 30,000, MA ≈ 9.4
* c = 40,000, MA ≈ 9.8
* c = 50,000, MA ≈ 10.1
* c = 60,000, MA ≈ 10.4
* c = 80,000, MA ≈ 10.7
* c = 100,000, MA ≈ 10.85
* c = 120,000, MA ≈ 10.95
* c = 150,000, MA ≈ 11.0
* c = 200,000, MA ≈ 11.1
* c = 250,000, MA ≈ 11.15
* c = 300,000, MA ≈ 11.2
### Key Observations
* The relationship between 'c' and 'MA' is clearly non-linear.
* The data suggests diminishing returns: increasing 'c' yields smaller and smaller increases in 'MA' as 'c' grows larger.
* The plot appears to be approaching an upper limit for 'MA', suggesting a saturation effect.
* The data is very dense, indicating a large sample size or a continuous process.
### Interpretation
The chart likely represents a saturation curve, where 'c' could represent a concentration of a substance, an input variable, or a resource, and 'MA' represents a measured effect or output. The initial steep increase suggests a rapid response to increasing 'c', but as 'c' increases, the system becomes saturated, and further increases in 'c' have a diminishing impact on 'MA'. This type of relationship is common in many scientific fields, such as chemistry (enzyme kinetics), pharmacology (drug response), and biology (population growth). The asymptotic behavior indicates that there is a maximum achievable value for 'MA', regardless of how large 'c' becomes. Without further context, it's difficult to determine the specific meaning of 'c' and 'MA', but the shape of the curve provides valuable insights into the underlying process.