\n
## Diagram: Hierarchical Decomposition
### Overview
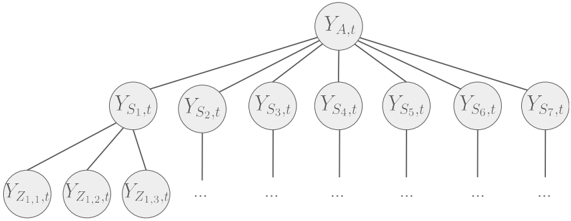
The image depicts a hierarchical decomposition diagram, likely representing a model or system broken down into its constituent parts. It shows a top-level node branching out into multiple intermediate nodes, which in turn branch out into further nodes. The diagram is purely schematic and does not contain numerical data.
### Components/Axes
The diagram consists of interconnected nodes. The nodes are labeled with variables, indicating their role in the hierarchy. The labels are as follows:
* **Top-level node:** Y<sub>A,t</sub>
* **Intermediate nodes:** Y<sub>S<sub>1,t</sub></sub>, Y<sub>S<sub>2,t</sub></sub>, Y<sub>S<sub>3,t</sub></sub>, Y<sub>S<sub>4,t</sub></sub>, Y<sub>S<sub>5,t</sub></sub>, Y<sub>S<sub>6,t</sub></sub>, Y<sub>S<sub>7,t</sub></sub>
* **Bottom-level nodes:** Y<sub>Z<sub>1,1,d</sub></sub>, Y<sub>Z<sub>1,2,d</sub></sub>, Y<sub>Z<sub>1,3,d</sub></sub>, and so on (indicated by "...")
The subscripts indicate different dimensions or indices:
* 'A' likely represents a category or aspect.
* 't' likely represents time.
* 'S<sub>i</sub>' likely represents sub-components or segments (i = 1 to 7).
* 'Z<sub>i,j</sub>' likely represents further sub-components or details (i = 1, j = 1 to 3 and beyond).
* 'd' likely represents another dimension or detail level.
The diagram uses directed arrows to show the flow or dependency from parent nodes to child nodes.
### Detailed Analysis or Content Details
The diagram shows a single top-level node (Y<sub>A,t</sub>) connected to seven intermediate nodes (Y<sub>S<sub>1,t</sub></sub> through Y<sub>S<sub>7,t</sub></sub>). Each of these intermediate nodes is connected to at least three bottom-level nodes (Y<sub>Z<sub>1,1,d</sub></sub> through Y<sub>Z<sub>1,3,d</sub></sub>), with the indication that this pattern continues ("...").
The structure suggests a hierarchical decomposition where the top-level variable is broken down into seven sub-variables, and each of those is further broken down into multiple components. The "..." notation indicates that the decomposition continues beyond the explicitly shown nodes.
### Key Observations
The diagram is symmetrical in terms of the number of intermediate nodes (seven). The bottom-level nodes are shown with only a few examples, suggesting a potentially large number of such nodes for each intermediate node. The diagram does not provide any quantitative information; it is purely structural.
### Interpretation
This diagram likely represents a model where a system or variable (Y<sub>A,t</sub>) is decomposed into its constituent parts. The hierarchical structure suggests that the system can be understood by analyzing its components at different levels of detail. The time index 't' suggests that the model is dynamic and considers changes over time. The 'd' index in the bottom-level nodes could represent different dimensions or aspects of those components.
The diagram could be used in various fields, such as:
* **Economics:** Decomposing aggregate demand (Y<sub>A,t</sub>) into its components (consumption, investment, government spending, etc.).
* **Engineering:** Breaking down a complex system into its subsystems.
* **Statistics:** Representing a hierarchical model where variables are nested within each other.
* **Machine Learning:** Representing a decision tree or a hierarchical clustering structure.
The diagram's simplicity suggests it is a conceptual representation rather than a detailed implementation. It serves to illustrate the hierarchical relationships between the variables without providing specific values or equations. The use of subscripts indicates that the variables are indexed by different dimensions, allowing for a more nuanced representation of the system.