## Bar Chart: Tool Performance Metrics
### Overview
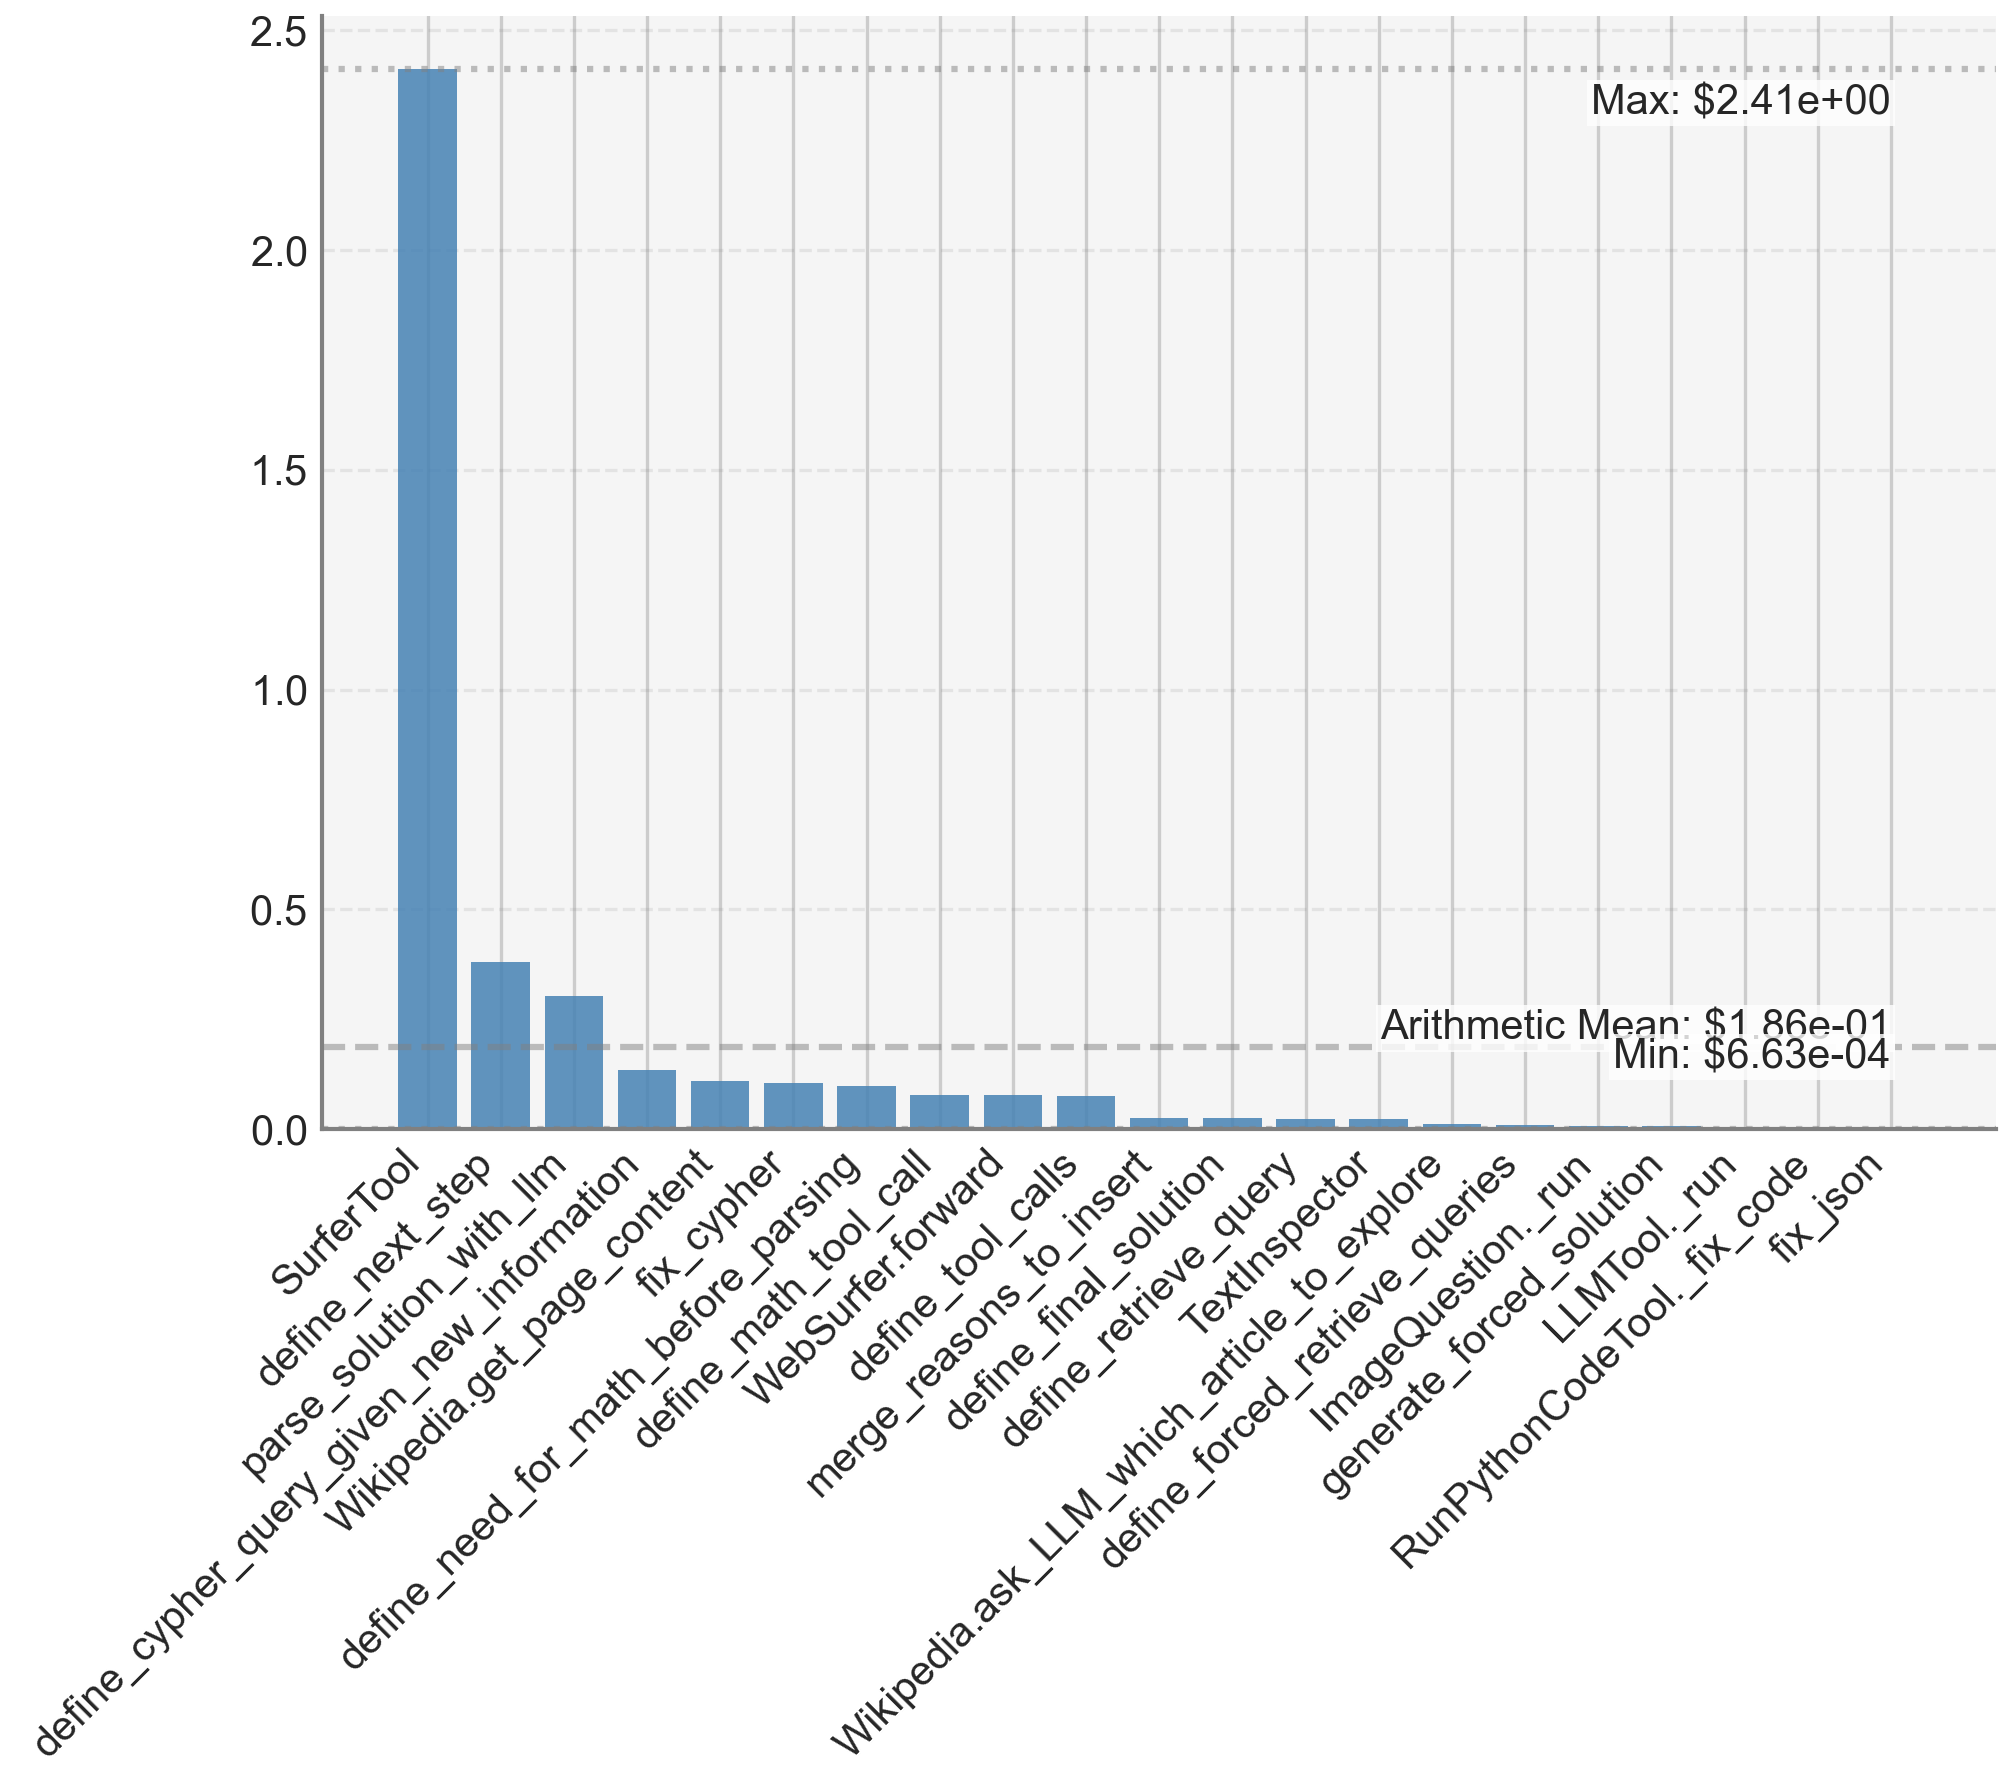
The image displays a vertical bar chart comparing numerical values (likely performance metrics, costs, or scores) across 20 distinct tools or functions. The chart is characterized by one dominant outlier and a long tail of significantly lower values. The data is presented on a linear scale with gridlines for reference.
### Components/Axes
* **Chart Type:** Vertical Bar Chart.
* **Y-Axis:** Linear scale ranging from 0.0 to 2.5, with major gridlines at intervals of 0.5. The axis is not explicitly labeled with a title, but the values are presented in a format suggesting currency or a normalized score (e.g., `$2.41e+00`).
* **X-Axis:** Categorical axis listing 20 tool/function names. The labels are rotated approximately 60 degrees for readability.
* **Annotations:**
* **Top-right corner:** "Max: $2.41e+00" (≈ 2.41). This corresponds to the tallest bar.
* **Right side, near the bottom:** "Arithmetic Mean: $1.86e-01" (≈ 0.186). A dashed horizontal line extends from this label across the chart.
* **Right side, below the mean:** "Min: $6.63e-04" (≈ 0.000663). This corresponds to the shortest bar(s).
* **Legend:** There is no separate legend. Each bar is a uniform blue color, and its category is defined by the x-axis label directly beneath it.
### Detailed Analysis
The following table lists the tools in the order they appear on the x-axis (left to right) with their approximate corresponding y-axis values, derived from visual estimation against the gridlines.
| Tool/Function Name | Approximate Value | Visual Trend & Notes |
| :--- | :--- | :--- |
| **SurferTool** | **~2.41** | **Extreme outlier.** The bar reaches the "Max" annotation line. It is over 6 times taller than the next highest bar. |
| **define_next_step** | ~0.38 | Second tallest bar, but a dramatic drop from the first. |
| **parse_solution_with_llm** | ~0.30 | Third tallest, continuing the steep decline. |
| **define_cypher_query_given_new_information** | ~0.12 | Value falls below the arithmetic mean line (~0.186). |
| **Wikipedia.get_page_content** | ~0.10 | |
| **fix_cypher** | ~0.09 | |
| **define_need_for_math_before_parsing** | ~0.08 | |
| **define_math_tool_call** | ~0.07 | |
| **WebSurfer.forward** | ~0.06 | |
| **define_tool_calls** | ~0.06 | |
| **merge_reasons_to_insert** | ~0.06 | |
| **define_final_solution** | ~0.02 | Value drops significantly again. |
| **define_retrieve_query** | ~0.02 | |
| **TextInspector** | ~0.01 | |
| **Wikipedia.ask_LLM_which_article_to_explore** | ~0.01 | |
| **define_forced_retrieve_queries** | ~0.005 | Bars become very short, approaching the baseline. |
| **ImageQuestion._run** | ~0.003 | |
| **generate_forced_retrieve_solution** | ~0.001 | |
| **LLMTool._run** | ~0.0008 | |
| **RunPythonCodeTool._fix_code** | ~0.0007 | |
| **fix_json** | **~0.000663** | **Minimum value.** Bar is barely visible, corresponding to the "Min" annotation. |
**Trend Verification:** The data series shows a **precipitous downward trend** from left to right. The first bar is an extreme outlier. The next two bars form a secondary tier, followed by a cluster of tools with values near or below the mean. The final eight tools have values approaching zero, forming a long, flat tail.
### Key Observations
1. **Dominant Outlier:** `SurferTool` has a value (~2.41) that is an order of magnitude higher than most other tools and over 6x higher than the second-place tool. This suggests it is either the most frequently used, the most costly, or the highest-scoring component in the measured context.
2. **Extreme Range:** The data spans nearly four orders of magnitude, from a maximum of ~2.41 to a minimum of ~0.000663. The arithmetic mean (~0.186) is heavily skewed by the outlier and is not representative of the typical tool value.
3. **Long Tail Distribution:** The chart exhibits a classic "long tail" or power-law distribution. A very small number of tools account for the vast majority of the total value, while the majority of tools contribute minimally.
4. **Clustering:** Tools can be loosely grouped into tiers: the primary outlier (`SurferTool`), a secondary tier (`define_next_step`, `parse_solution_with_llm`), a middle cluster (tools 4-11, values ~0.06-0.12), and a low-value tail (tools 12-20, values <0.03).
### Interpretation
This chart likely visualizes a performance metric for an AI agent or complex software system composed of multiple specialized tools. The metric could represent **computational cost (e.g., API call cost in dollars), execution time, frequency of invocation, or a performance score.**
* **What the data suggests:** The system's operation is overwhelmingly dominated by the `SurferTool`. This tool is either the core engine of the system, a particularly expensive operation (like a web search or complex computation), or a bottleneck. The next tier of tools (`define_next_step`, `parse_solution_with_llm`) are also significant, likely representing key planning and reasoning steps.
* **Relationship between elements:** The tools form a pipeline or toolkit. The distribution suggests a workflow where one or two primary tools do the heavy lifting, supported by a suite of smaller, specialized utilities for tasks like data parsing (`parse_solution_with_llm`), knowledge retrieval (`Wikipedia.*`), code fixing (`fix_cypher`, `fix_json`), and validation (`TextInspector`).
* **Notable implications:** The extreme skew indicates that optimizing the system's overall performance or cost would yield the greatest returns by focusing on the `SurferTool`. The long tail of low-value tools suggests they are either rarely called, very efficient, or have a minimal impact on the measured metric. The presence of tools with names like `define_*` and `*_run` hints at a structured, possibly agentic, architecture where tools are dynamically selected and executed.