## Line Graphs: I-Don't-Know Rate vs. Layer for Mistral-7B Models
### Overview
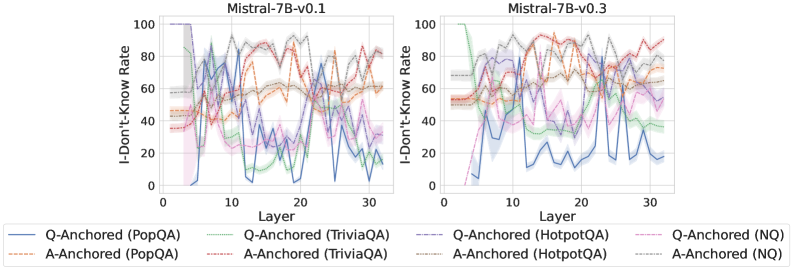
The image presents two line graphs comparing the "I-Don't-Know Rate" across different layers of two versions of the Mistral-7B model (v0.1 and v0.3). Each graph plots the I-Don't-Know Rate (percentage) against the layer number (1 to 32). Different colored lines represent different question-answering datasets and anchoring methods (Q-Anchored and A-Anchored). The graphs aim to show how the model's uncertainty varies across layers and datasets.
### Components/Axes
* **Titles:**
* Left Graph: "Mistral-7B-v0.1"
* Right Graph: "Mistral-7B-v0.3"
* **Y-Axis (Vertical):**
* Label: "I-Don't-Know Rate"
* Scale: 0 to 100, with tick marks at 0, 20, 40, 60, 80, and 100.
* Units: Percentage.
* **X-Axis (Horizontal):**
* Label: "Layer"
* Scale: 0 to 30, with tick marks at 0, 10, 20, and 30.
* Units: Layer Number.
* **Legend (Bottom):**
* Q-Anchored (PopQA): Solid Blue Line
* A-Anchored (PopQA): Dashed Brown Line
* Q-Anchored (TriviaQA): Dotted Green Line
* A-Anchored (TriviaQA): Dash-Dot Gray Line
* Q-Anchored (HotpotQA): Dash-Dot-Dot Red Line
* A-Anchored (HotpotQA): Dotted Orange Line
* Q-Anchored (NQ): Dashed Purple Line
* A-Anchored (NQ): Dotted Light Gray Line
### Detailed Analysis
**Left Graph: Mistral-7B-v0.1**
* **Q-Anchored (PopQA) (Solid Blue):** Starts at approximately 100% at layer 0, drops sharply to near 0% by layer 5, then fluctuates between 0% and 40% for the remaining layers.
* **A-Anchored (PopQA) (Dashed Brown):** Starts around 50% and fluctuates between 40% and 70% across all layers.
* **Q-Anchored (TriviaQA) (Dotted Green):** Starts at approximately 100% at layer 0, drops sharply to near 0% by layer 10, then fluctuates between 0% and 40% for the remaining layers.
* **A-Anchored (TriviaQA) (Dash-Dot Gray):** Starts around 60% and fluctuates between 50% and 70% across all layers.
* **Q-Anchored (HotpotQA) (Dash-Dot-Dot Red):** Starts around 40% and fluctuates between 40% and 90% across all layers.
* **A-Anchored (HotpotQA) (Dotted Orange):** Starts around 50% and fluctuates between 50% and 70% across all layers.
* **Q-Anchored (NQ) (Dashed Purple):** Starts around 40% and fluctuates between 10% and 50% across all layers.
* **A-Anchored (NQ) (Dotted Light Gray):** Starts around 50% and fluctuates between 50% and 70% across all layers.
**Right Graph: Mistral-7B-v0.3**
* **Q-Anchored (PopQA) (Solid Blue):** Starts at approximately 100% at layer 0, drops sharply to near 0% by layer 5, then fluctuates between 10% and 40% for the remaining layers.
* **A-Anchored (PopQA) (Dashed Brown):** Starts around 60% and fluctuates between 60% and 80% across all layers.
* **Q-Anchored (TriviaQA) (Dotted Green):** Starts around 100% at layer 0, drops sharply to near 10% by layer 10, then fluctuates between 10% and 40% for the remaining layers.
* **A-Anchored (TriviaQA) (Dash-Dot Gray):** Starts around 60% and fluctuates between 60% and 80% across all layers.
* **Q-Anchored (HotpotQA) (Dash-Dot-Dot Red):** Starts around 50% and fluctuates between 70% and 90% across all layers.
* **A-Anchored (HotpotQA) (Dotted Orange):** Starts around 60% and fluctuates between 60% and 80% across all layers.
* **Q-Anchored (NQ) (Dashed Purple):** Starts around 50% and fluctuates between 20% and 60% across all layers.
* **A-Anchored (NQ) (Dotted Light Gray):** Starts around 60% and fluctuates between 60% and 80% across all layers.
### Key Observations
* For both model versions, the Q-Anchored (PopQA) and Q-Anchored (TriviaQA) datasets show a significant drop in the I-Don't-Know Rate within the first few layers.
* The A-Anchored datasets generally exhibit a more stable and higher I-Don't-Know Rate across all layers compared to their Q-Anchored counterparts.
* The Mistral-7B-v0.3 model appears to have a slightly higher overall I-Don't-Know Rate for most datasets compared to v0.1.
### Interpretation
The graphs suggest that the Mistral-7B models are more uncertain about their answers when the answer is anchored (A-Anchored) compared to when the question is anchored (Q-Anchored). The sharp initial drop in I-Don't-Know Rate for Q-Anchored (PopQA) and Q-Anchored (TriviaQA) indicates that the model quickly gains confidence in its answers for these datasets as it processes the initial layers. The higher overall I-Don't-Know Rate in v0.3 might indicate a change in the model's calibration or a different trade-off between accuracy and uncertainty. The fluctuations in the I-Don't-Know Rate across layers could be related to the specific computations performed in each layer and how they contribute to the model's understanding of the question and answer.