## Line Chart: Accuracy vs. # Solutions per Problem
### Overview
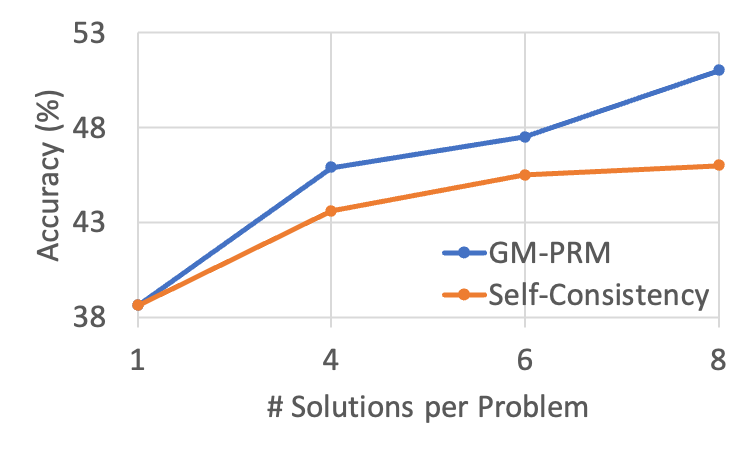
The image is a line chart illustrating the performance comparison between two methods, "GM-PRM" and "Self-Consistency," across varying numbers of solutions generated per problem. The chart demonstrates how accuracy scales as the number of solutions increases from 1 to 8.
### Components/Axes
* **Y-Axis:** Labeled "Accuracy (%)". The scale ranges from 38 to 53, with horizontal grid lines at intervals of 5 units (38, 43, 48, 53).
* **X-Axis:** Labeled "# Solutions per Problem". The axis displays discrete data points at 1, 4, 6, and 8.
* **Legend:** Located in the bottom-right quadrant of the chart area.
* **Blue line with circular markers:** Labeled "GM-PRM".
* **Orange line with circular markers:** Labeled "Self-Consistency".
### Detailed Analysis
**Trend Verification:**
Both data series exhibit a positive correlation, where accuracy increases as the number of solutions per problem increases. The "GM-PRM" series (blue) demonstrates a steeper, more consistent upward slope compared to the "Self-Consistency" series (orange), which begins to flatten as the number of solutions increases.
**Data Extraction (Approximate Values):**
| # Solutions per Problem | GM-PRM (Blue) | Self-Consistency (Orange) |
| :--- | :--- | :--- |
| **1** | ~38.5% | ~38.5% |
| **4** | ~45.8% | ~43.5% |
| **6** | ~47.5% | ~45.5% |
| **8** | ~51.2% | ~46.0% |
* **At 1 Solution:** Both methods start at the same baseline accuracy of approximately 38.5%.
* **At 4 Solutions:** GM-PRM rises to ~45.8%, while Self-Consistency rises to ~43.5%.
* **At 6 Solutions:** GM-PRM reaches ~47.5%, while Self-Consistency reaches ~45.5%.
* **At 8 Solutions:** GM-PRM continues to climb to ~51.2%, whereas Self-Consistency shows a significant plateau, reaching only ~46.0%.
### Key Observations
* **Divergence:** While both methods perform identically at the baseline (1 solution), they diverge significantly as the number of solutions increases.
* **Performance Gap:** The gap between the two methods widens as the number of solutions increases. At 4 solutions, the gap is ~2.3%. By 8 solutions, the gap expands to ~5.2%.
* **Diminishing Returns:** The Self-Consistency method exhibits clear signs of diminishing returns, with the slope of the line becoming nearly horizontal between 6 and 8 solutions. In contrast, the GM-PRM method maintains a more robust upward trajectory.
### Interpretation
The data demonstrates that GM-PRM is significantly more effective than Self-Consistency at leveraging additional generated solutions to improve overall accuracy.
The "Self-Consistency" method appears to hit a performance ceiling relatively early, suggesting that simply generating more solutions does not yield proportional gains in accuracy for this method. Conversely, the "GM-PRM" method continues to extract value from the additional solutions, indicating it is a more scalable approach for tasks requiring high accuracy. This suggests that GM-PRM likely employs a more sophisticated mechanism for evaluating or selecting the correct solution from a larger candidate pool than the standard Self-Consistency approach.