\n
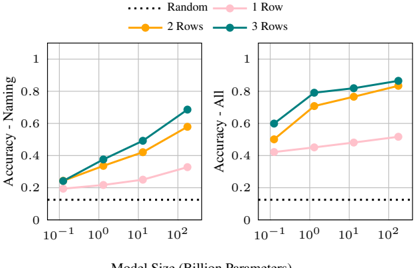
## Line Chart: Accuracy vs. Model Size
### Overview
The image presents two line charts comparing the accuracy of a naming task and an "All" task across different model sizes and numbers of rows. The x-axis represents model size in billions of parameters (logarithmic scale), and the y-axis represents accuracy. Each chart displays four data series, each representing a different number of rows (1, 2, 3) or a random baseline.
### Components/Axes
* **X-axis Label:** "Model Size (Billion Parameters)"
* **X-axis Scale:** Logarithmic, with markers at 10<sup>-1</sup>, 10<sup>0</sup>, and 10<sup>2</sup>.
* **Y-axis Label (Left Chart):** "Accuracy - Naming"
* **Y-axis Scale (Left Chart):** Linear, ranging from approximately 0.2 to 1.0.
* **Y-axis Label (Right Chart):** "Accuracy - All"
* **Y-axis Scale (Right Chart):** Linear, ranging from approximately 0.55 to 0.9.
* **Legend:** Located at the top-center of the image.
* "Random" - Black dotted line
* "1 Row" - Light pink solid line
* "2 Rows" - Orange solid line
* "3 Rows" - Teal solid line
### Detailed Analysis or Content Details
**Left Chart (Accuracy - Naming):**
* **Random (Black Dotted Line):** The line is relatively flat, starting at approximately 0.21 and ending at approximately 0.24.
* **1 Row (Light Pink Line):** The line slopes upward, starting at approximately 0.21 and ending at approximately 0.33.
* **2 Rows (Orange Line):** The line slopes upward more steeply than the "1 Row" line, starting at approximately 0.26 and ending at approximately 0.53.
* **3 Rows (Teal Line):** The line slopes upward even more steeply than the "2 Rows" line, starting at approximately 0.28 and ending at approximately 0.66.
**Right Chart (Accuracy - All):**
* **Random (Black Dotted Line):** The line is relatively flat, starting at approximately 0.58 and ending at approximately 0.61.
* **1 Row (Light Pink Line):** The line slopes upward gently, starting at approximately 0.58 and ending at approximately 0.68.
* **2 Rows (Orange Line):** The line slopes upward more steeply than the "1 Row" line, starting at approximately 0.55 and ending at approximately 0.82.
* **3 Rows (Teal Line):** The line slopes upward, starting at approximately 0.59 and ending at approximately 0.88.
### Key Observations
* In both charts, increasing the number of rows generally leads to higher accuracy.
* The "Random" baseline remains relatively constant across all model sizes, indicating it is not sensitive to model capacity.
* The "3 Rows" data series consistently achieves the highest accuracy in both charts.
* The difference in accuracy between the "1 Row" and "2 Rows" series is more pronounced than the difference between the "2 Rows" and "3 Rows" series, particularly in the "Accuracy - Naming" chart.
* The "Accuracy - All" chart shows a higher overall accuracy compared to the "Accuracy - Naming" chart.
### Interpretation
The data suggests that increasing the model size and the number of rows used in the model improves accuracy for both the naming task and the "All" task. The consistent performance of the "Random" baseline indicates that the observed improvements are due to the model's ability to learn from the data, rather than random chance. The diminishing returns observed when increasing from 2 to 3 rows suggest that there may be a point of saturation where adding more rows does not significantly improve performance. The higher accuracy in the "Accuracy - All" chart suggests that the model performs better when considering all available information, rather than focusing solely on naming. This could be due to the fact that the naming task is more challenging and requires more nuanced understanding of the data. The logarithmic scale on the x-axis indicates that the benefits of increasing model size may diminish as the model becomes larger. This is a common phenomenon in machine learning, as larger models can become more difficult to train and may not always generalize well to new data.