# Technical Document Extraction: GTransformer Architecture Diagram
## 1. Overview
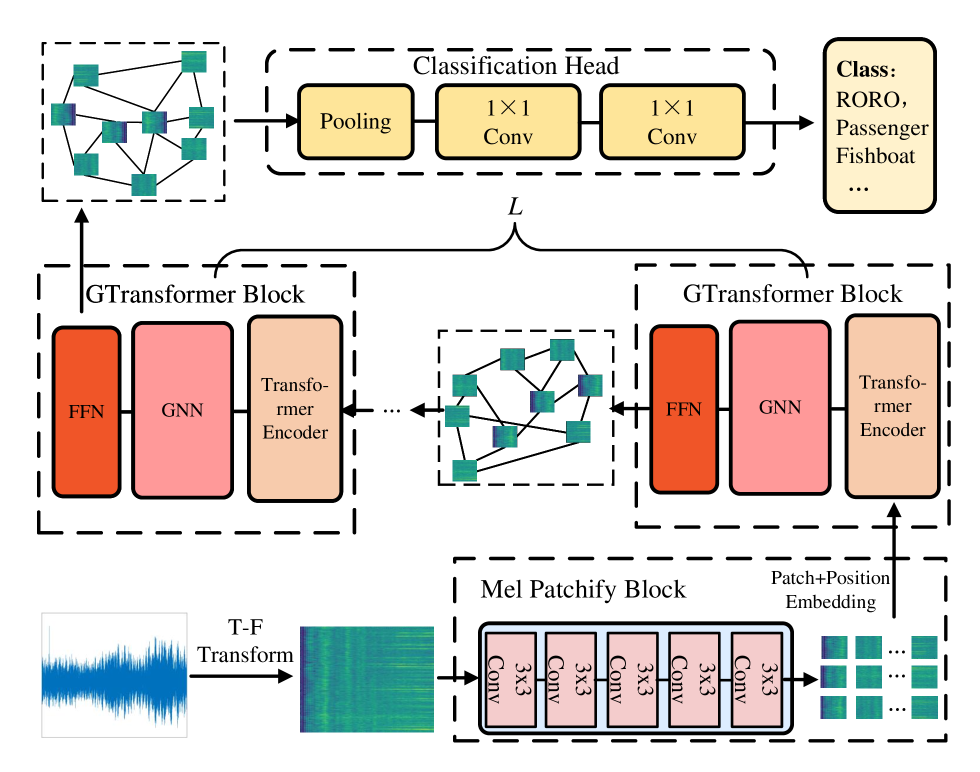
This image illustrates a technical architecture for an audio classification system, likely utilizing a Graph Transformer (GTransformer) approach. The pipeline processes raw audio signals into spectrograms, extracts patch-based embeddings, processes them through a series of graph-based transformer blocks, and concludes with a classification head.
---
## 2. Component Isolation and Flow Analysis
### Region 1: Input and Pre-processing (Bottom Left to Bottom Right)
* **Input Signal:** A blue waveform representing a raw audio signal.
* **Process:** An arrow labeled **"T-F Transform"** (Time-Frequency Transform) converts the waveform into a Mel-spectrogram (visualized as a green/yellow heatmap).
* **Mel Patchify Block:** The spectrogram enters a dashed container labeled "Mel Patchify Block".
* **Internal Components:** A sequence of four identical modules labeled **"3x3 Conv"**.
* **Output:** The block outputs a grid of small spectrogram patches. An arrow points upward, labeled **"Patch+Position Embedding"**, indicating the integration of spatial/temporal information.
### Region 2: GTransformer Blocks (Middle Section)
The architecture features a repetitive structure indicated by a bracket labeled **"$L$"**, suggesting $L$ number of layers or blocks.
* **GTransformer Block Structure:** Each block (contained in a dashed rectangle) consists of three sequential sub-modules:
1. **Transformer Encoder** (Light orange/peach color)
2. **GNN** (Graph Neural Network - Pink color)
3. **FFN** (Feed-Forward Network - Dark orange/red color)
* **Data Flow:**
* The "Patch+Position Embedding" enters the first GTransformer Block from the bottom.
* Between the blocks, there is a visualization of a **Graph Structure**. This graph consists of nodes (represented by the spectrogram patches) connected by black lines (edges), indicating relational modeling between different parts of the audio signal.
* An ellipsis (**...**) indicates that this block structure repeats $L$ times.
### Region 3: Classification Head (Top Section)
* **Input:** The final graph representation (nodes and edges) from the last GTransformer block is passed to the classification stage.
* **Classification Head (Dashed Box):**
1. **Pooling:** A yellow rounded rectangle. This likely aggregates the graph node features into a global representation.
2. **1x1 Conv:** A yellow rounded rectangle.
3. **1x1 Conv:** A second yellow rounded rectangle for further feature refinement.
* **Final Output (Class Box):** A light yellow box on the far right.
* **Header:** **Class:**
* **Labels:** **RORO, Passenger, Fishboat, ...**
* *Note:* These labels suggest the model is designed for maritime acoustic classification (e.g., identifying ship types).
---
## 3. Textual Transcription
| Category | Transcribed Text |
| :--- | :--- |
| **Process Labels** | T-F Transform, Patch+Position Embedding |
| **Main Blocks** | Mel Patchify Block, GTransformer Block, Classification Head |
| **Sub-Modules** | 3x3 Conv, Transformer Encoder, GNN, FFN, Pooling, 1x1 Conv |
| **Variables** | $L$ (representing the number of layers) |
| **Output Classes** | Class: RORO, Passenger, Fishboat, ... |
---
## 4. Technical Summary of Logic
1. **Feature Extraction:** The system uses a convolutional "Mel Patchify Block" to break down a spectrogram into local features.
2. **Relational Modeling:** Unlike standard Transformers that use self-attention on a sequence, this model uses a **GNN** within a **GTransformer Block** to model the audio patches as nodes in a graph, capturing non-linear relationships between different time-frequency segments.
3. **Global Aggregation:** The **Pooling** layer in the Classification Head collapses the graph-based features into a single vector for the final **1x1 Convolutional** layers to perform the multi-class classification task.